When to tap maple trees in Quebec
- Opens
- Mar 14
- typical
- Closes
- Apr 18
- typical
- Typical length
- 34days
Division by division
When the sap runs across Quebec
Loading the map…
Typical opening date of the sap season, week by week across this province’s range
- Mar 5–8
- Mar 9–15
- Mar 16–22
- Mar 23–29
- Mar 30–31
- fewer than 5 maple farms
83 places with an atlas page. Typical season opening, earliest: Brome-Missisquoi, QC, Mar 5; Le Haut-Saint-Laurent, QC, Mar 6; La Haute-Yamaska, QC, Mar 7; latest: La Haute-Gaspésie, QC, Mar 31; Abitibi, QC, Mar 30; La Matanie, QC, Mar 29. Most sap days a season: Coaticook, QC, 37; Beauce-Sartigan, QC, 36; Antoine-Labelle, QC, 36. Maple taps in the 2021 Census of Agriculture, on a five-step scale fitted to Quebec: under 110,000, 110,000–260,000, 260,000–480,000, 480,000–1,200,000, 1,200,000+; the most: Témiscouata, QC (5,062,870), Le Granit, QC (5,056,082), Les Appalaches, QC (3,508,831), Beauce-Sartigan, QC (2,866,417), L'Islet, QC (2,826,410). Maple farms in the same census, in five steps: under 13, 13–35, 35–60, 60–150, 150+; the most: Les Appalaches, QC (576), Beauce-Sartigan, QC (538), Le Granit, QC (519). Syrup made, in US gallons: Le Granit, QC (≈ 2.3 million gal), Témiscouata, QC (≈ 2 million gal), Les Appalaches, QC (≈ 1.4 million gal). PPAQ pounds converted at 11.1 lb per US gallon (the density of finished syrup). Canadian divisions have no official count. 20 places show an earlier census figure (dotted) because the latest was withheld; those figures don’t set the bins. Each shaded place links to its page; every state and province page lists its places in a table.
| Brome-Missisquoi | Mar 5 – Apr 14 | 32 | 492,709 |
|---|---|---|---|
| Le Haut-Saint-Laurent | Mar 6 – Apr 14 | 28 | 834,590 |
| La Haute-Yamaska | Mar 7 – Apr 15 | 29 | 655,626 |
| Rouville | Mar 7 – Apr 15 | 26 | 158,243 |
| Le Haut-Richelieu | Mar 7 – Apr 11 | 27 | 50,376 (2016) |
| La Vallée-du-Richelieu | Mar 7 – Apr 14 | 26 | 233,539 |
| Roussillon | Mar 7 – Apr 11 | 25 | withheld |
| Les Jardins-de-Napierville | Mar 7 – Apr 14 | 27 | 78,672 |
| Beauharnois-Salaberry | Mar 7 – Apr 15 | 26 | 65,453 |
| Acton | Mar 8 – Apr 15 | 28 | 359,190 |
| Les Maskoutains | Mar 8 – Apr 15 | 26 | 365,377 |
| Longueuil | Mar 8 – Apr 14 | 25 | withheld |
| Laval | Mar 8 – Apr 13 | 24 | 10,850 (2016) |
| Vaudreuil-Soulanges | Mar 8 – Apr 14 | 24 | 171,102 |
| Gatineau | Mar 8 – Apr 15 | 29 | 4,170 (2016) |
| Sherbrooke | Mar 9 – Apr 17 | 34 | 24,470 (2016) |
| Marguerite-D'Youville | Mar 9 – Apr 14 | 25 | 54,977 |
| Les Moulins | Mar 9 – Apr 15 | 25 | 4,192 (2016) |
| Montréal | Mar 9 – Apr 14 | 24 | 5,530 (2016) |
| Deux-Montagnes | Mar 9 – Apr 14 | 25 | 251,250 |
| Memphrémagog | Mar 10 – Apr 17 | 33 | 321,668 |
| D'Autray | Mar 10 – Apr 15 | 24 | 174,052 (2016) |
| L'Assomption | Mar 10 – Apr 15 | 25 | 40,247 |
| Argenteuil | Mar 10 – Apr 15 | 26 | 97,773 |
| Le Haut-Saint-François | Mar 11 – Apr 18 | 36 | 967,821 |
| Le Val-Saint-François | Mar 11 – Apr 17 | 33 | 764,271 |
| Drummond | Mar 11 – Apr 16 | 27 | 479,915 |
| Mirabel | Mar 11 – Apr 16 | 26 | 369,919 |
| Coaticook | Mar 12 – Apr 20 | 37 | 891,643 |
| Pierre-De Saurel | Mar 12 – Apr 15 | 23 | 37,680 |
| Joliette | Mar 12 – Apr 16 | 27 | 52,495 |
| Les Collines-de-l'Outaouais | Mar 12 – Apr 20 | 30 | 63,760 |
| Arthabaska | Mar 13 – Apr 20 | 30 | 1,745,283 |
| Les Sources | Mar 13 – Apr 22 | 31 | 257,952 |
| Nicolet-Yamaska | Mar 13 – Apr 18 | 24 | 284,959 |
| Montcalm | Mar 13 – Apr 18 | 27 | 450,184 |
| La Rivière-du-Nord | Mar 13 – Apr 20 | 27 | 49,558 (2016) |
| Papineau | Mar 13 – Apr 21 | 31 | 125,331 |
| Bécancour | Mar 14 – Apr 19 | 24 | 281,941 |
| Maskinongé | Mar 14 – Apr 16 | 23 | 56,495 (2011) |
| Francheville | Mar 15 – Apr 21 | 24 | 89,272 (2016) |
| Robert-Cliche | Mar 16 – Apr 23 | 35 | 1,078,782 |
| Beauce-Sartigan | Mar 16 – Apr 24 | 36 | 2,866,417 |
| La Vallée-de-la-Gatineau | Mar 16 – Apr 23 | 35 | 104,300 |
| Pontiac | Mar 16 – Apr 24 | 35 | 6,043 (2016) |
| Les Appalaches | Mar 17 – Apr 24 | 30 | 3,508,831 |
| L'Érable | Mar 17 – Apr 23 | 29 | 2,139,113 |
| Les Pays-d'en-Haut | Mar 17 – Apr 24 | 32 | 53,500 |
| La Nouvelle-Beauce | Mar 18 – Apr 24 | 30 | 1,222,914 |
| Shawinigan | Mar 18 – Apr 24 | 28 | 6,200 (2016) |
| Matawinie | Mar 18 – Apr 23 | 30 | 235,245 |
| Québec | Mar 19 – Apr 23 | 24 | 70,802 (2016) |
| Le Granit | Mar 19 – Apr 24 | 36 | 5,056,082 |
| Antoine-Labelle | Mar 19 – Apr 26 | 36 | 562,198 |
| Montmagny | Mar 20 – Apr 23 | 25 | 1,147,794 |
| Bellechasse | Mar 20 – Apr 24 | 26 | 2,161,913 |
| Lotbinière | Mar 20 – Apr 24 | 27 | 1,310,593 |
| Mékinac | Mar 20 – Apr 27 | 31 | 315,791 |
| Charlevoix | Mar 21 – Apr 24 | 24 | 26,050 (2011) |
| L'Islet | Mar 21 – Apr 24 | 25 | 2,826,410 |
| L'Île-d'Orléans | Mar 21 – Apr 24 | 25 | 111,550 |
| Lévis | Mar 21 – Apr 24 | 25 | 42,135 (2016) |
| Les Laurentides | Mar 21 – Apr 28 | 34 | 184,798 |
| La Côte-de-Beaupré | Mar 22 – Apr 25 | 25 | 51,506 (2016) |
| Portneuf | Mar 22 – Apr 27 | 29 | 1,217,016 |
| Témiscamingue | Mar 22 – Apr 29 | 30 | 139,621 |
| Kamouraska | Mar 23 – Apr 25 | 25 | 172,104 |
| Les Etchemins | Mar 23 – Apr 29 | 31 | 1,738,699 |
| Le Saguenay-et-son-Fjord | Mar 24 – Apr 29 | 28 | 17,919 (2016) |
| Rivière-du-Loup | Mar 25 – Apr 26 | 21 | 449,137 |
| Lac-Saint-Jean-Est | Mar 25 – May 1 | 29 | 3,806 (2016) |
| Les Basques | Mar 26 – Apr 25 | 20 | 797,644 |
| Témiscouata | Mar 26 – Apr 29 | 27 | 5,062,870 |
| La Jacques-Cartier | Mar 26 – Apr 30 | 27 | 12,185 (2016) |
| Le Domaine-du-Roy | Mar 26 – May 3 | 30 | withheld |
| Avignon | Mar 27 – May 1 | 28 | 198,253 |
| Rimouski-Neigette | Mar 27 – Apr 26 | 21 | 824,952 |
| Bonaventure | Mar 28 – May 1 | 26 | 15,700 (2011) |
| La Mitis | Mar 28 – Apr 30 | 22 | 480,486 |
| La Matapédia | Mar 29 – May 4 | 27 | 261,585 |
| La Matanie | Mar 29 – Apr 30 | 23 | 48,700 |
| Abitibi | Mar 30 – May 4 | 32 | withheld |
| La Haute-Gaspésie | Mar 31 – Apr 30 | 21 | 150,783 |
Taps with a year in brackets are that earlier census’s count, shown where the latest was withheld; they sort after the published counts.
Sap-flow outlook right now
Full Quebec forecast →Forecast for Saint-Georges
Updated Nov 10, 5:00 AM EST
Off-season
Quebec's season opens in about 124 days
Typical opening: March 14.
What to do now
- 1
Hold the drill
Fall sap is low in sugar, and a November hole on buckets is spent by January.
- 2
Find and mark your trees
Easiest while the leaves are on. Tapping starts at 12 inches across, about 38 inches around.
- 3
Gather your gear
A drill with a clean 5/16-inch bit, one spout per taphole, covered food-grade buckets.
Show this week’s forecast anywayHide the forecast
Only marginal days ahead
freeze thaw 0 °C
- WedNov 110° / 4°No refreeze forecast
- ThuNov 12-7° / 3°Maybe a light run
- FriNov 13-1° / 4°Maybe a light run
- SatNov 140° / 4°No refreeze forecast
- SunNov 15-1° / 3°Maybe a light run
- MonNov 16-1° / 3°Maybe a light run
Data: Environment and Climate Change Canada. Verdicts use freeze-thaw thresholds from maple field research; your woods may run a little differently.
Timing your taps
How to know it's time in Quebec
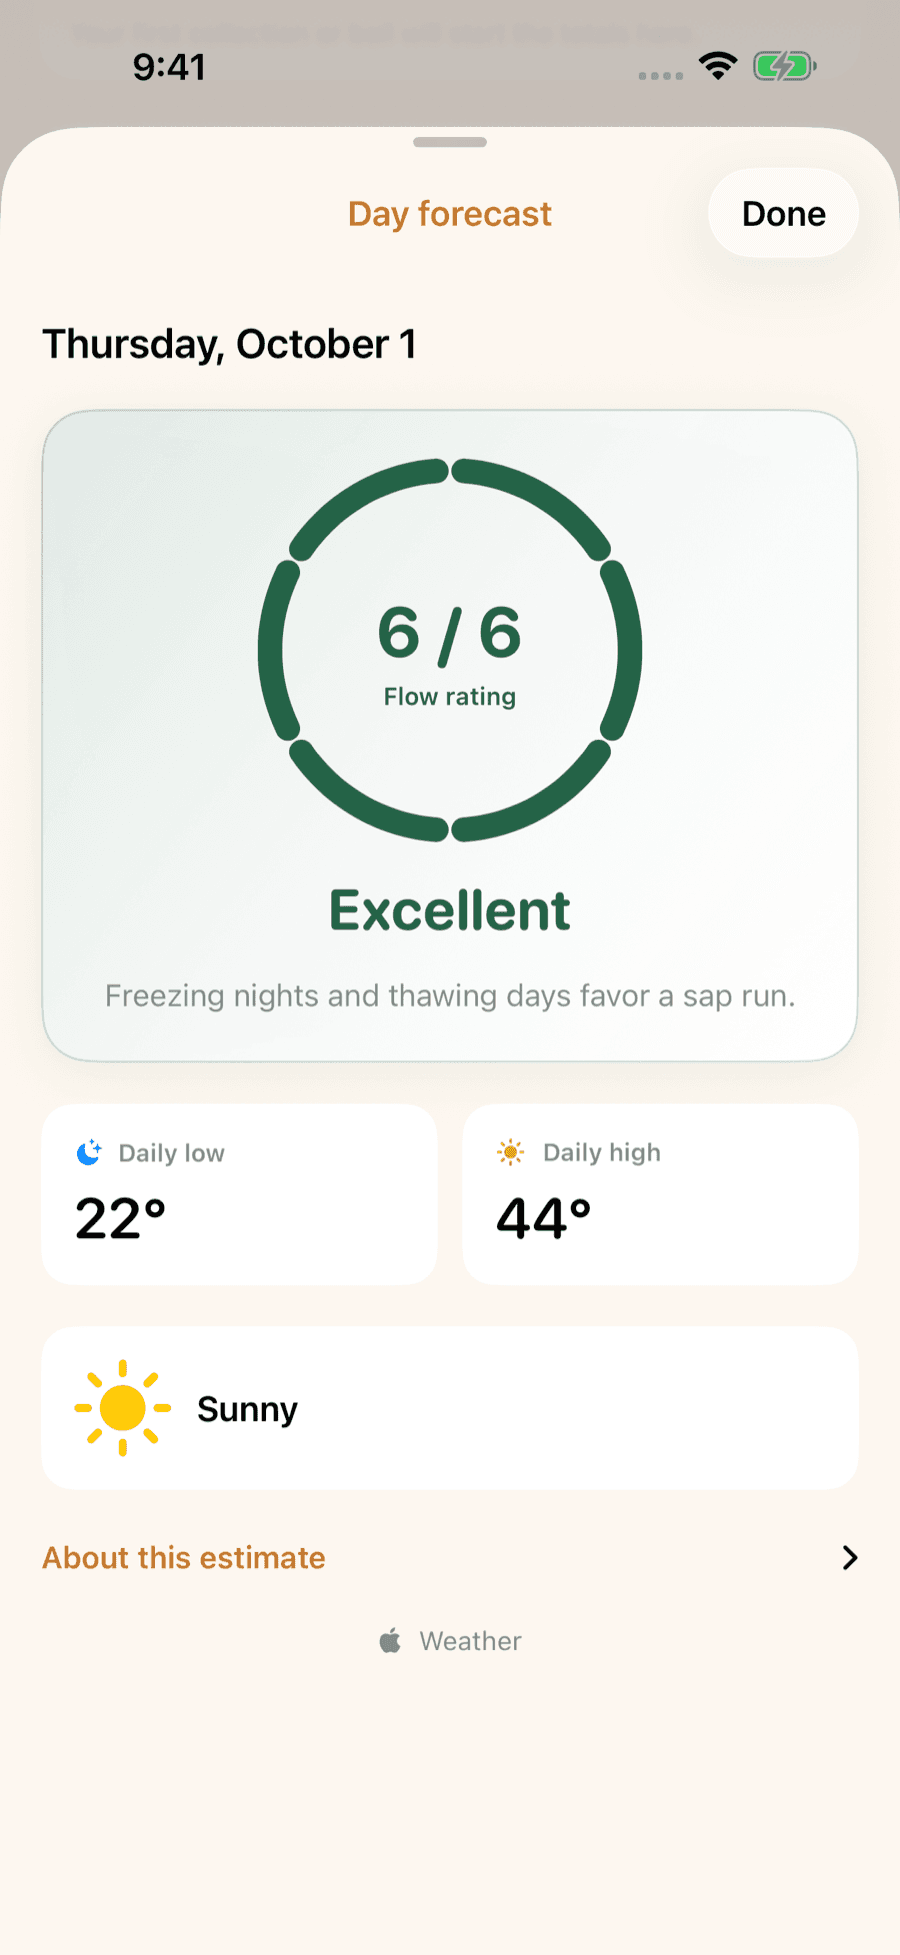
Sap runs on a temperature swing, not a date. A night below freezing loads the tree; a day above freezing pushes sap out of the taphole. Field research treats a low under about 30°F followed by a high over about 37°F as a real freeze-thaw day, and big runs almost always come on days like that.
So watch the 10-day forecast. When you see a string of nights in the 20s and afternoons in the 40s, get your taps in a day or two ahead. South-facing slopes warm first and usually run earlier.
From weekly syrup-production data at 121 producers in 11 regions, 1999–2011 (Houle et al. 2015). Typical dates are the median of the 11 regional means: southern regions (Valleyfield, Saint-Hyacinthe) start around Mar 6–7, Beauce around Mar 14 and Bas-Saint-Laurent around Mar 24. Year-to-year swings are large: the earliest regional start was Feb 22 (2010) and the latest Apr 14 (2003). No per-year provincial dates are published, so history is empty.
Seasons are shifting. In Québec, the sap season is projected to start and end 9–13 days earlier by 2046–2065 and 15–19 days earlier by 2081–2100 than in 1971–2000; season onset advances about four days for each degree Celsius of warming (Houle et al., PLoS ONE, 2015).
Where Quebec's sugaring happens
- Saint-GeorgesChaudière-Appalaches, home of the Beauce, has 20.5 million of Québec's 55.6 million taps (37%), the most of any region (PPAQ, 2025).
- DégelisBas-Saint-Laurent/Gaspésie ranks second with 10.6 million taps (PPAQ, 2025) and has the latest regional start in Houle et al. 2015 (about Mar 24).
- Lac-MéganticEstrie ranks third with 9.6 million taps (PPAQ, 2025).
FAQ
Quebec tapping questions
- When is maple syrup season in Quebec?
- Usually from mid-March to mid-April, about 5 weeks. The exact start moves by weeks from year to year with the weather.
- When should I tap my trees in Quebec?
- Tap just before the first good run: when the forecast shows nights below freezing and days climbing to around 40°F. In a typical year that's around March 14. Tapholes dry up within 6 to 10 weeks, so tapping far too early can cost you the late runs.
Nearby
When to tap in other provinces

LuckySap · free on iPhone & Android
Get a heads-up when Quebec's sap will run
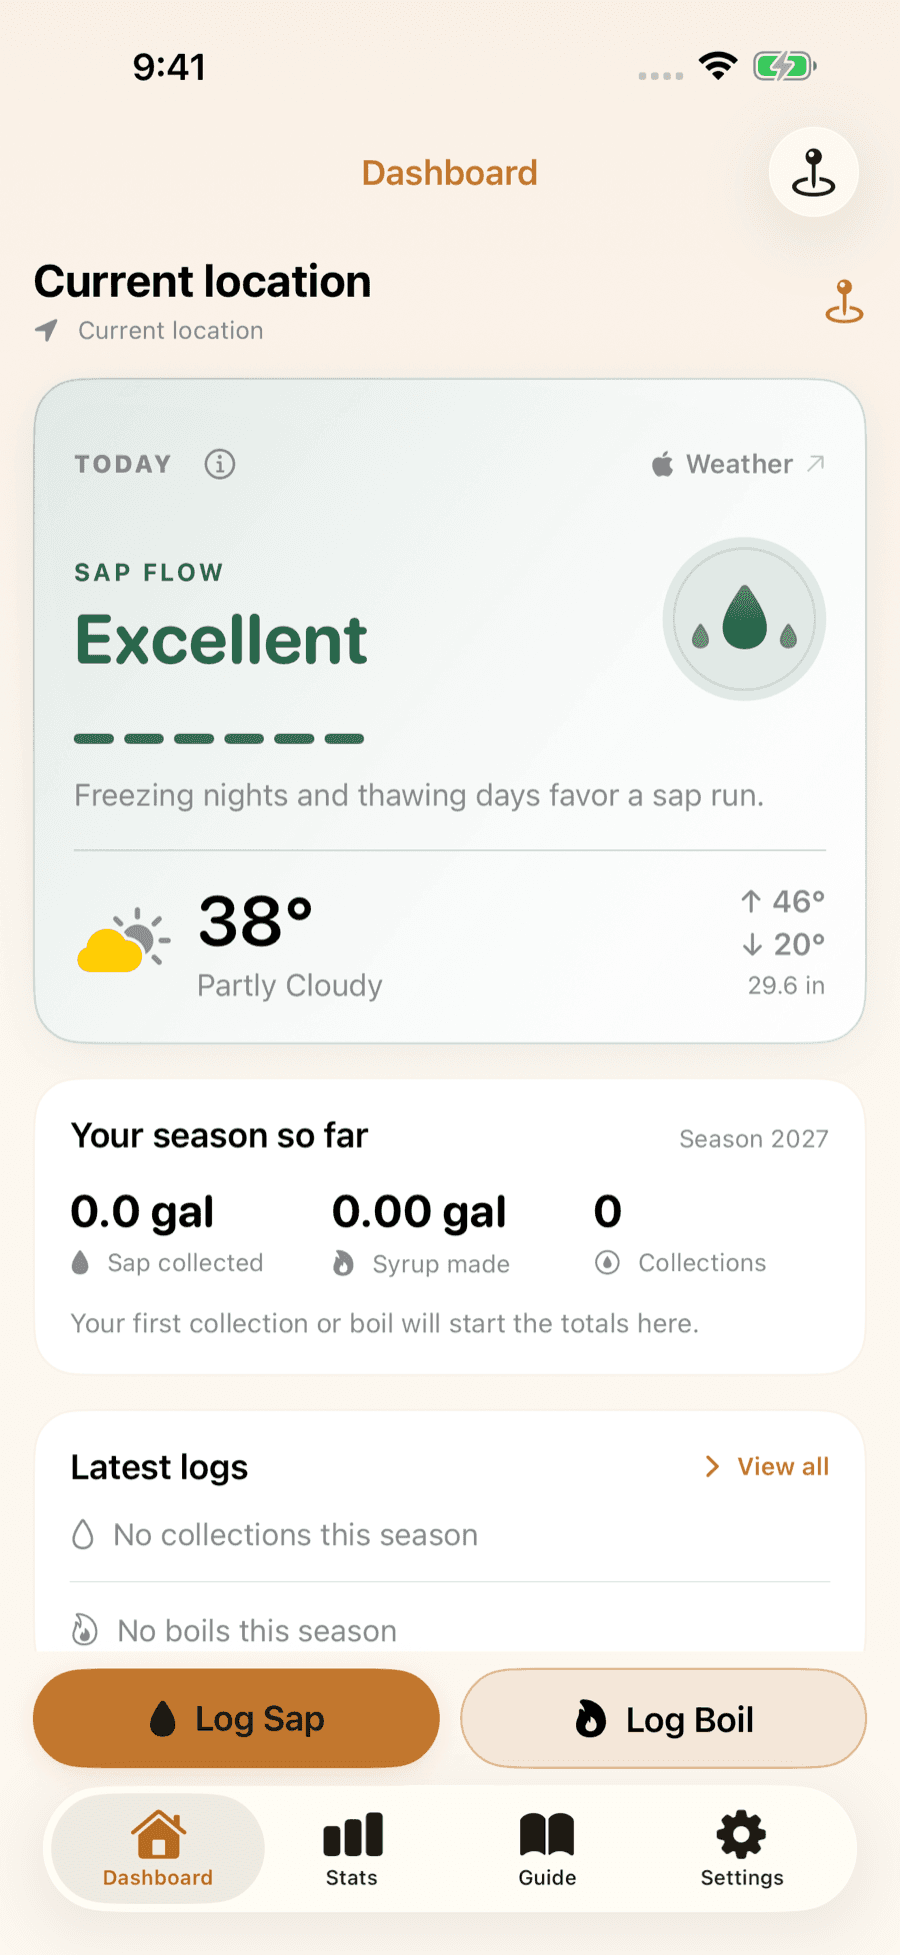
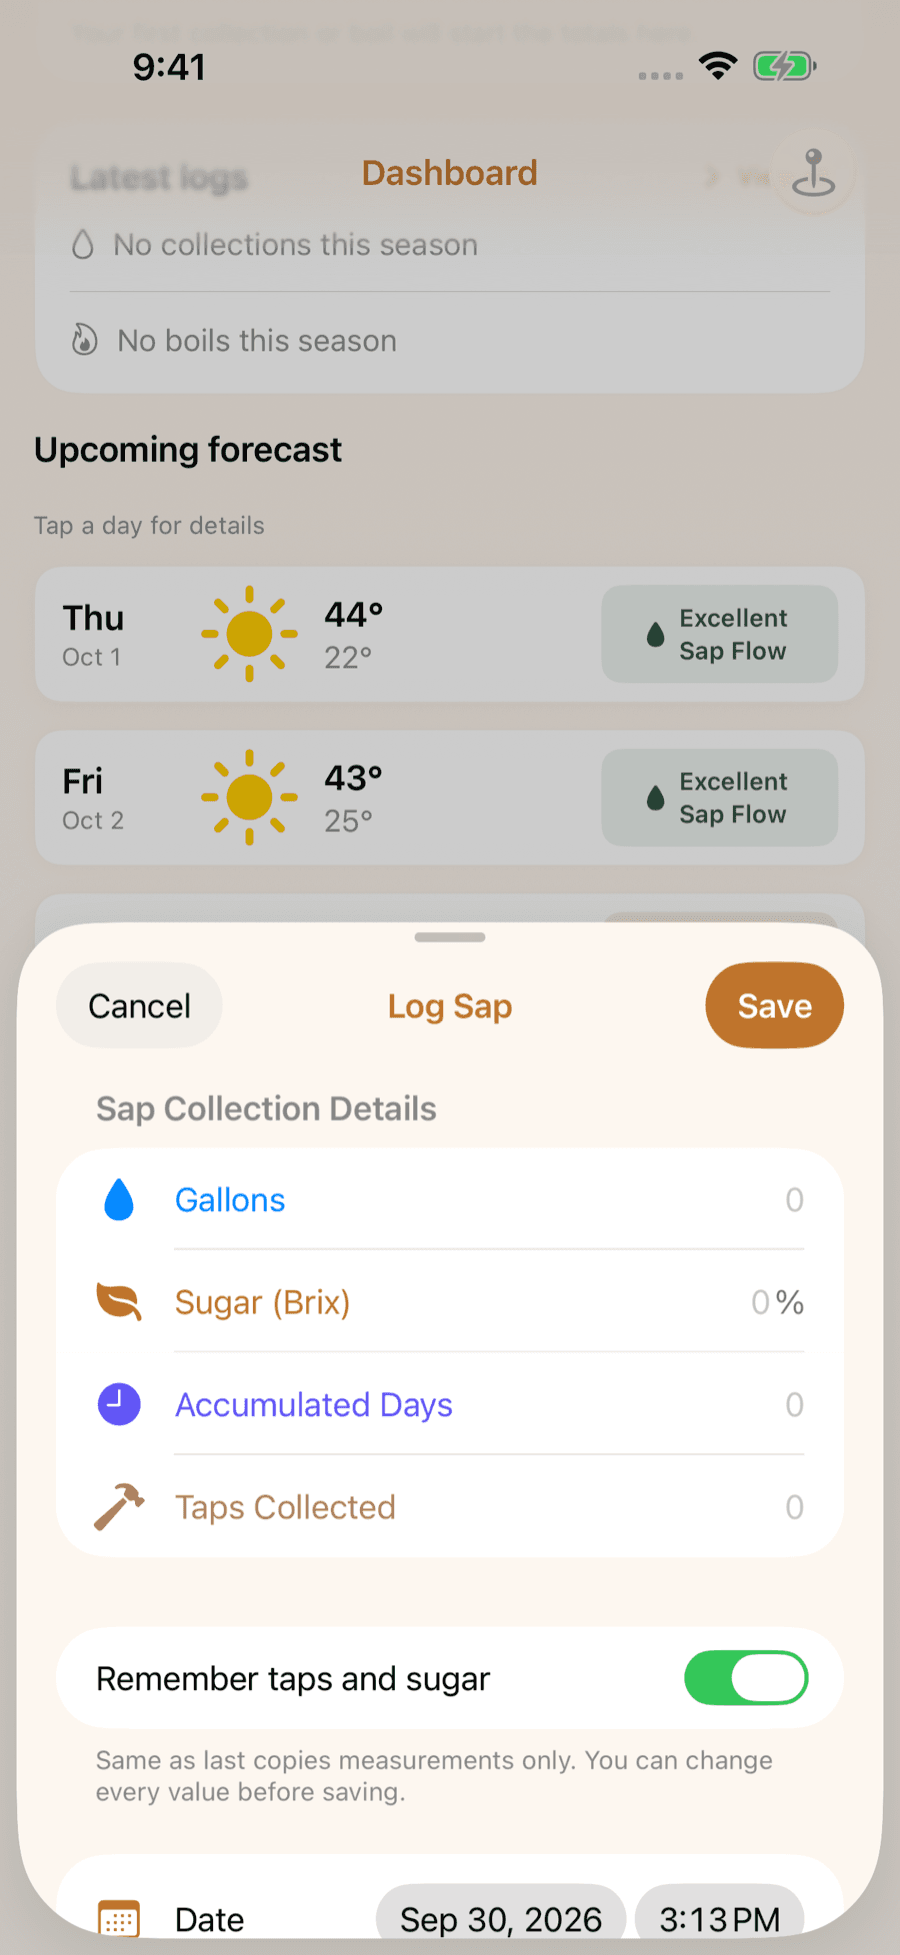
LuckySap checks the forecast for your trees and can ping you the night before a strong sap day, then keeps every collection and boil in one season log. Free on iPhone and Android.