When to tap maple trees in New York
- Opens
- Feb 28
- median, USDA
- Closes
- Apr 5
- median, USDA
- Typical length
- 33days
- Seasons on record
- 12
- 2011–2022
County by county
When the sap runs across New York
Loading the map…
Typical opening date of the sap season, week by week across this state’s range
- Feb 2–15
- Feb 16–22
- Feb 23–Mar 1
- Mar 2–8
- Mar 9–17
- fewer than 5 maple farms
53 places with an atlas page. Typical season opening, earliest: Westchester County, NY, Feb 2; Dutchess County, NY, Feb 15; Greene County, NY, Feb 16; latest: Hamilton County, NY, Mar 17; Lewis County, NY, Mar 10; Franklin County, NY, Mar 10. Most sap days a season: Ulster County, NY, 57; Steuben County, NY, 55; Delaware County, NY, 55. Maple taps in the 2022 Census of Agriculture, on a five-step scale fitted to New York: under 6,400, 6,400–17,000, 17,000–44,000, 44,000–77,000, 77,000+; the most: Clinton County, NY (365,777), Wyoming County, NY (320,339), St. Lawrence County, NY (277,319), Lewis County, NY (243,375), Franklin County, NY (135,217). Maple farms in the same census, in five steps: under 10, 10–14, 14–26, 26–42, 42+; the most: St. Lawrence County, NY (106), Lewis County, NY (86), Franklin County, NY (76). Syrup made, in US gallons: Wyoming County, NY (115,220 gal), Clinton County, NY (79,219 gal), St. Lawrence County, NY (71,351 gal). Tappable maples (FIA estimates of sugar maples 10 in and up on forest land, US counties only): under 1.4 million, 1.4–1.9 million, 1.9–3.1 million, 3.1–5.2 million, 5.2 million+; the most: Hamilton County, NY (about 15 million ± 11%), Essex County, NY (about 14 million ± 12%), St. Lawrence County, NY (about 10 million ± 15%). 3 counties' estimates are too uncertain to show (sampling error over 50%). 1 county has none tallied on the inventory plots (not a zero). 1 place shows an earlier census figure (dotted) because the latest was withheld; those figures don’t set the bins. Each shaded place links to its page; every state and province page lists its places in a table.
| Westchester | Feb 2 – Mar 10 | 34 | withheld |
|---|---|---|---|
| Dutchess | Feb 15 – Mar 24 | 54 | 22,265 |
| Greene | Feb 16 – Mar 26 | 49 | 1,723 |
| Columbia | Feb 17 – Mar 26 | 50 | 14,953 |
| Orange | Feb 17 – Mar 25 | 49 | 30,255 |
| Putnam | Feb 17 – Mar 25 | 48 | 150 |
| Ulster | Feb 17 – Mar 26 | 57 | 13,631 |
| Albany | Feb 19 – Mar 27 | 40 | 11,925 |
| Rensselaer | Feb 19 – Mar 27 | 40 | 9,302 |
| Schuyler | Feb 19 – Mar 25 | 39 | 65,678 |
| Tompkins | Feb 19 – Mar 26 | 45 | 3,087 |
| Chemung | Feb 20 – Mar 28 | 51 | 6,421 |
| Livingston | Feb 20 – Mar 28 | 42 | 6,853 |
| Monroe | Feb 20 – Mar 27 | 32 | 1,022 (2017) |
| Ontario | Feb 20 – Mar 28 | 39 | 23,737 |
| Orleans | Feb 21 – Mar 28 | 34 | 2,227 |
| Seneca | Feb 21 – Mar 26 | 33 | 1,260 |
| Wayne | Feb 21 – Mar 28 | 34 | 5,350 |
| Yates | Feb 21 – Mar 27 | 36 | 9,686 |
| Cayuga | Feb 22 – Mar 31 | 39 | 52,926 |
| Onondaga | Feb 22 – Mar 26 | 33 | 58,641 |
| Schenectady | Feb 22 – Mar 27 | 38 | 1,375 |
| Genesee | Feb 23 – Mar 31 | 38 | 17,318 |
| Saratoga | Feb 23 – Mar 30 | 41 | 2,480 |
| Broome | Feb 24 – Mar 31 | 47 | 12,730 |
| Erie | Feb 24 – Mar 29 | 30 | 40,330 |
| Tioga | Feb 24 – Mar 31 | 50 | 27,738 |
| Chautauqua | Feb 25 – Apr 2 | 37 | 64,688 |
| Madison | Feb 25 – Apr 2 | 35 | 21,893 |
| Oneida | Feb 26 – Apr 4 | 36 | 33,770 |
| Oswego | Feb 26 – Mar 30 | 26 | 29,530 |
| Schoharie | Feb 26 – Apr 5 | 45 | 44,083 |
| Steuben | Feb 26 – Apr 5 | 55 | 83,385 |
| Wyoming | Feb 26 – Apr 4 | 41 | 320,339 |
| Allegany | Feb 27 – Apr 6 | 50 | 57,417 |
| Herkimer | Feb 27 – Apr 5 | 39 | 4,204 |
| Montgomery | Feb 27 – Apr 5 | 40 | withheld |
| Sullivan | Feb 27 – Apr 5 | 43 | 76,535 |
| Chenango | Mar 1 – Apr 7 | 47 | 57,185 |
| Cortland | Mar 1 – Apr 4 | 38 | 15,725 |
| Otsego | Mar 1 – Apr 8 | 49 | 73,799 |
| Washington | Mar 1 – Apr 8 | 41 | 98,989 |
| Delaware | Mar 2 – Apr 8 | 55 | 76,806 |
| Cattaraugus | Mar 3 – Apr 8 | 43 | 100,515 |
| Warren | Mar 3 – Apr 9 | 42 | 12,760 |
| Fulton | Mar 4 – Apr 9 | 38 | 44,239 |
| Jefferson | Mar 5 – Apr 7 | 36 | 84,490 |
| Clinton | Mar 6 – Apr 9 | 33 | 365,777 |
| Essex | Mar 7 – Apr 12 | 45 | 56,746 |
| St. Lawrence | Mar 8 – Apr 13 | 37 | 277,319 |
| Franklin | Mar 10 – Apr 16 | 36 | 135,217 |
| Lewis | Mar 10 – Apr 15 | 36 | 243,375 |
| Hamilton | Mar 17 – Apr 22 | 45 | 5,255 |
Taps with a year in brackets are that earlier census’s count, shown where the latest was withheld; they sort after the published counts.
Sap-flow outlook right now
Full New York forecast →Forecast for Ellenburg
Updated Nov 10, 1:37 AM EST
Off-season
New York's season opens in about 110 days
Typical opening: February 28.
What to do now
- 1
Hold the drill
Fall sap is low in sugar, and a November hole on buckets is spent by January.
- 2
Find and mark your trees
Easiest while the leaves are on. Tapping starts at 12 inches across, about 38 inches around.
- 3
Gather your gear
A drill with a clean 5/16-inch bit, one spout per taphole, covered food-grade buckets.
Show this week’s forecast anywayHide the forecast
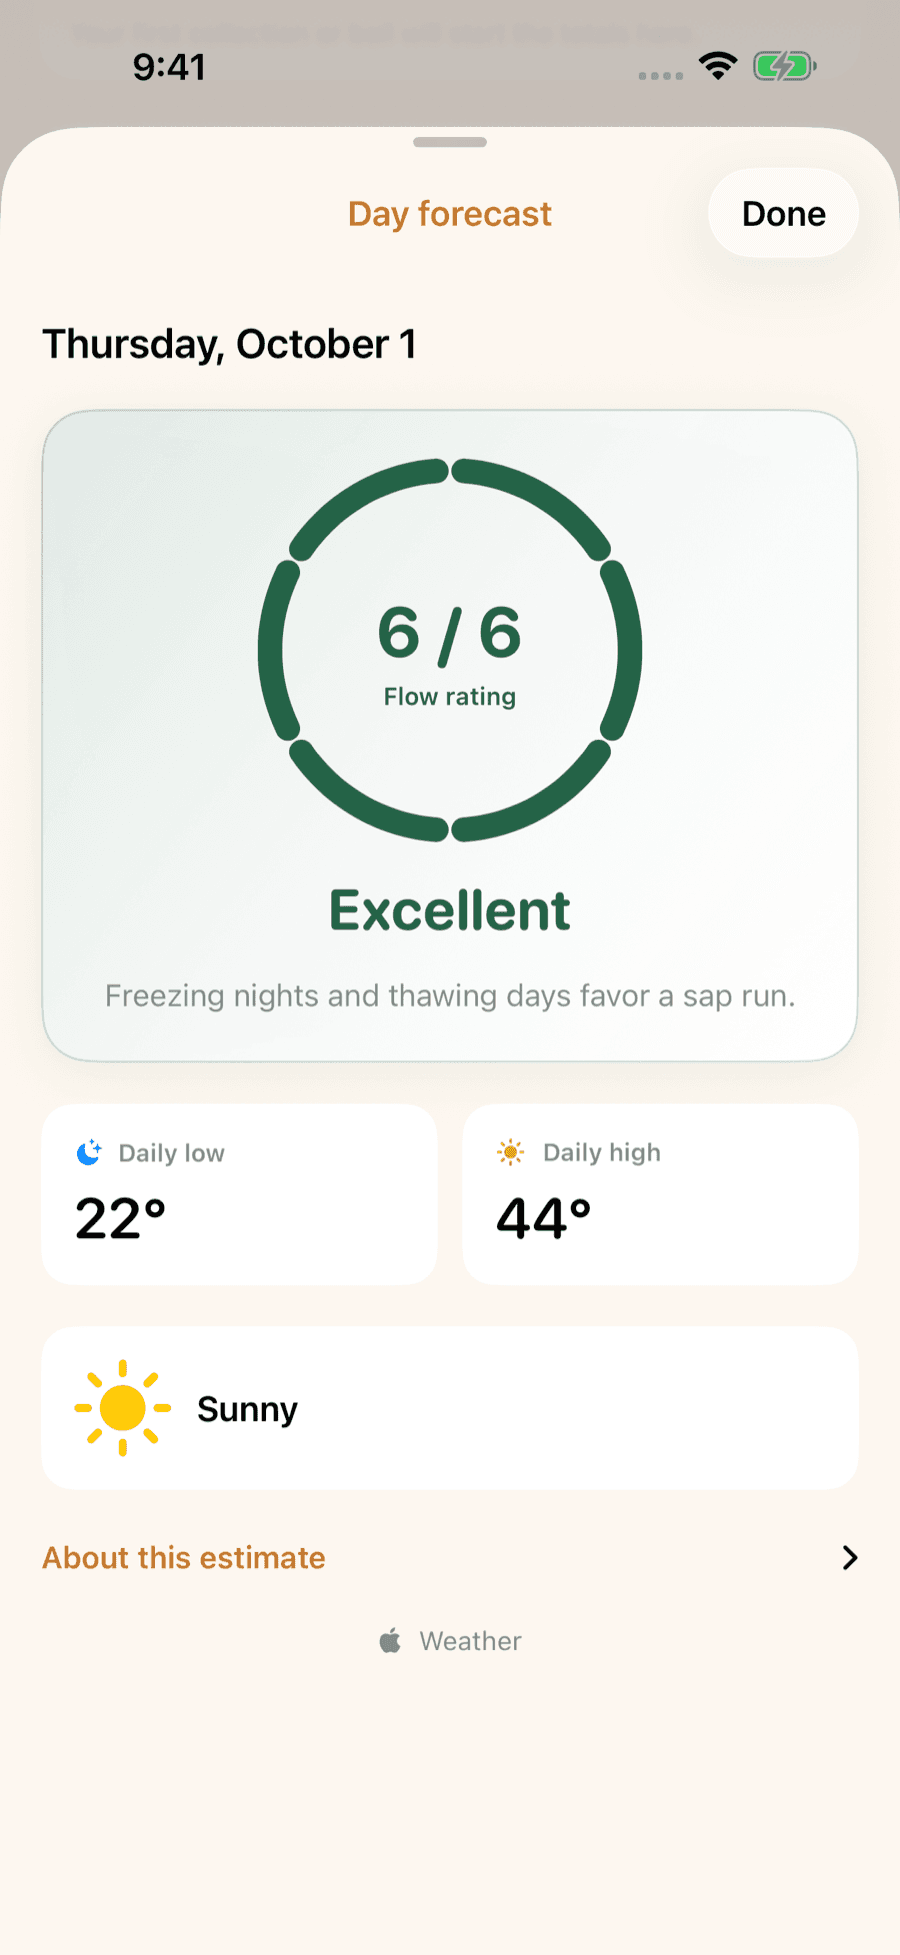
Only marginal days ahead
freeze thaw 32°F
- WedNov 1131° / 39°
3h below · 15h above
Maybe a light run - ThuNov 1229° / 37°
13h below · 9h above
Maybe a light run - FriNov 1327° / 33°
20h below · 1h above
Maybe a light run - SatNov 1427° / 33°
14h below · 6h above
Maybe a light run - SunNov 1529° / 35°
11h below · 10h above
Maybe a light run - MonNov 1626° / 36°Maybe a light run
Data: National Weather Service. Verdicts use freeze-thaw thresholds from maple field research; your woods may run a little differently.
Season history
New York maple seasons, 2011–2022
| Year | Opened | Closed | Days |
|---|---|---|---|
| 2022 | Feb 28 | Apr 2 | 33 |
| 2021 | Mar 4 | Apr 2 | 29 |
| 2020 | Feb 19 | Mar 28 | 38 |
| 2019 | Mar 6 | Apr 7 | 32 |
| 2018 | Feb 18 | Apr 11 | 52 |
| 2017 | Feb 18 | Apr 2 | 43 |
| 2016 | Feb 22 | Mar 29 | 36 |
| 2015 | Mar 17 | Apr 12 | 26 |
| 2014 | Mar 13 | Apr 14 | 32 |
| 2013 | Feb 27 | Apr 9 | 41 |
| 2012 | Feb 21 | Mar 16 | 24 |
| 2011 | Mar 5 | Apr 7 | 33 |
Timing your taps
How to know it's time in New York
Sap runs on a temperature swing, not a date. A night below freezing loads the tree; a day above freezing pushes sap out of the taphole. Field research treats a low under about 30°F followed by a high over about 37°F as a real freeze-thaw day, and big runs almost always come on days like that.
So watch the 10-day forecast. When you see a string of nights in the 20s and afternoons in the 40s, get your taps in a day or two ahead. South-facing slopes warm first and usually run earlier.
Dates are USDA NASS approximate state averages. Production is split between the North Country (Clinton, St. Lawrence, Lewis counties) and western New York (Wyoming County) (2022 Census of Agriculture).
New York made 884,000 gallons of maple syrup in 2026, 15.0% of the US crop (USDA NASS). See every state’s crop.
Seasons are shifting. In New England and New York, the sugaring season now begins about 8 days earlier and ends about 11 days earlier than it did 40 years earlier, leaving it roughly 3 days (about 10%) shorter, according to UVM Proctor Maple Research Center survey records analyzed in 2007.
Where New York's sugaring happens
- EllenburgClinton County has the most taps in New York, 365,777 (2022 Census of Agriculture).
- ArcadeWyoming County in western New York made the most syrup in the state, 115,220 gallons (2022 Census of Agriculture).
- CantonSt. Lawrence County has the most maple farms in New York (106) and 277,319 taps (2022 Census of Agriculture).
FAQ
New York tapping questions
- When is maple syrup season in New York?
- Usually from late February to early April, about 5 weeks. The exact start moves by weeks from year to year with the weather.
- When should I tap my trees in New York?
- Tap just before the first good run: when the forecast shows nights below freezing and days climbing to around 40°F. In a typical year that's around February 28. Tapholes dry up within 6 to 10 weeks, so tapping far too early can cost you the late runs.
- What's the earliest maple season has started in New York?
- In USDA records for 2011–2022, the earliest average opening was February 18 (2017) and the latest was March 17 (2015), a spread of 27 days.

LuckySap · free on iPhone & Android
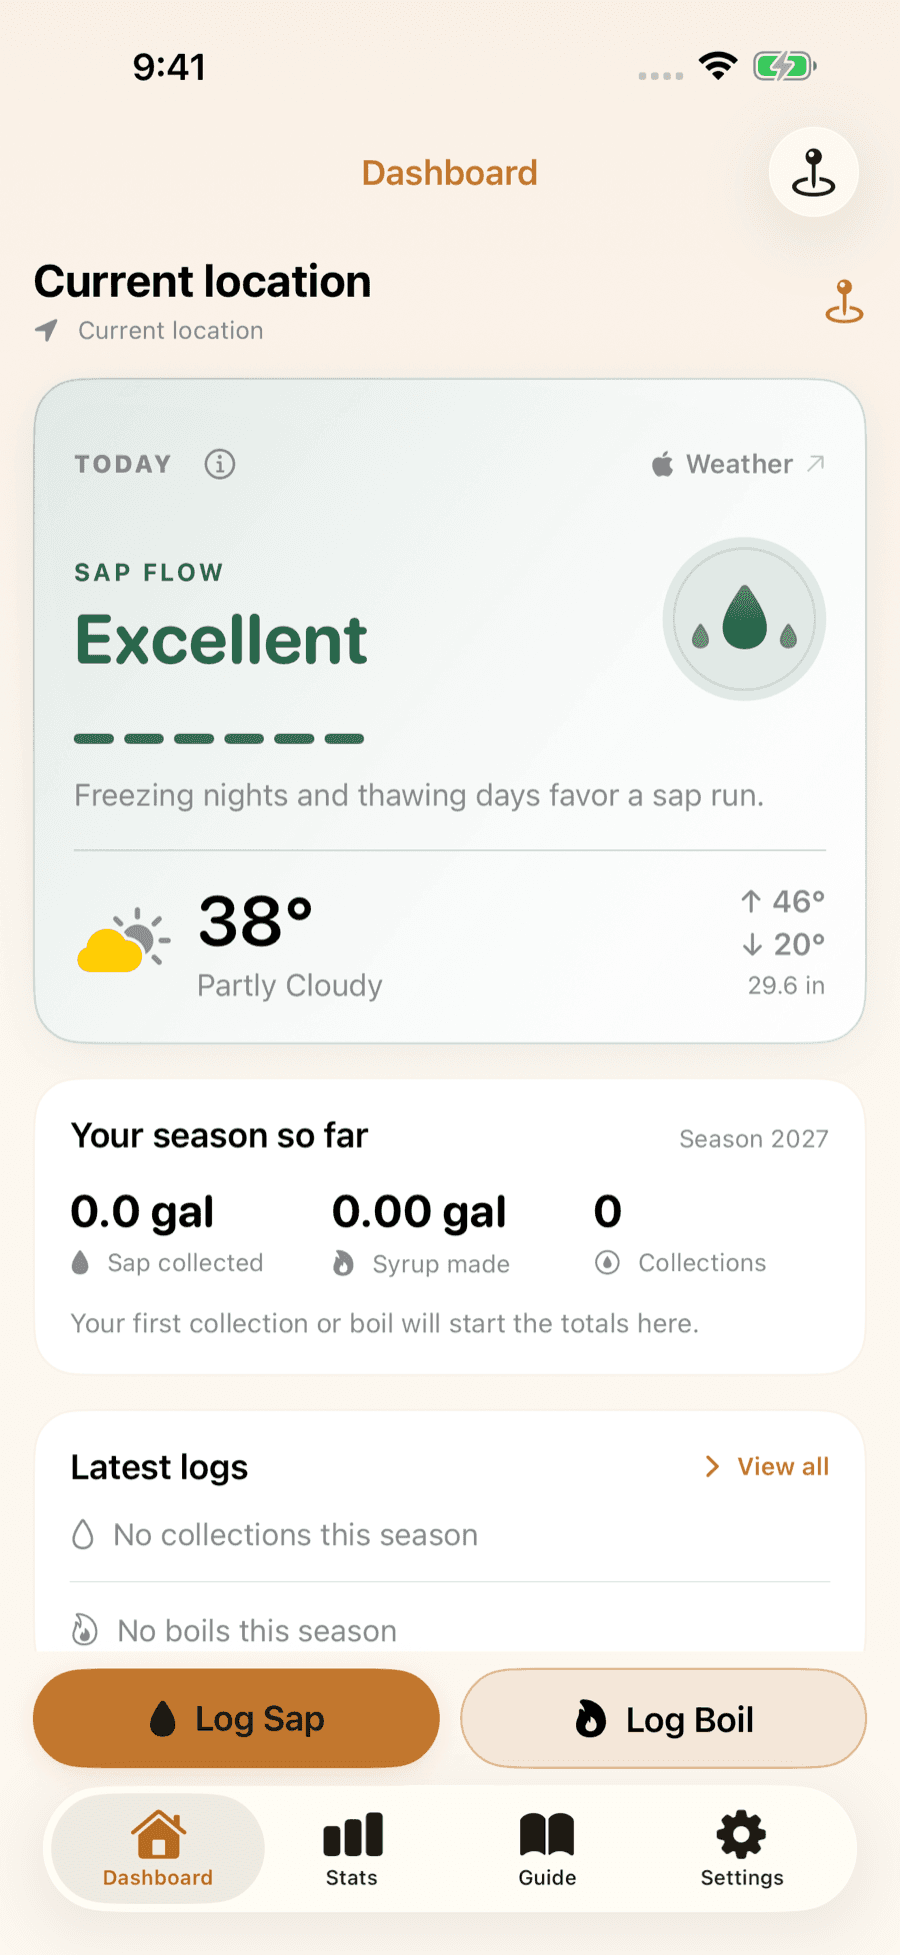
Get a heads-up when New York's sap will run
LuckySap checks the forecast for your trees and can ping you the night before a strong sap day, then keeps every collection and boil in one season log. Free on iPhone and Android.