Where, and when, the sap runs: county by county
Try St. Albans, Lindsay or Le Granit.
- US counties
- 385
- with 5+ maple farms
- Canadian divisions
- 143
- with 5+ farms reporting taps
- US taps, 2022
- 18M
- 9,322 farms · 5.8M gal
- Canadian taps, 2021
- 55M
- province totals
One belt, two countries
The maple belt doesn’t stop at the border
Loading the map…
Maple taps in the latest census: US 2022, Canada 2021, on one scale
- under 1,000
- 1,000–5,000
- 5,000–20,000
- 20,000–100,000
- 100,000+
- 2017, 2016 or 2011 figure (latest census withheld)
- taps withheld
- fewer than 5 maple farms
528 places with an atlas page. Typical season opening, earliest: Harrison County, IN, Jan 14; Crittenden County, KY, Jan 15; Hardin County, KY, Jan 17; latest: Restigouche, NB, Apr 2; Gloucester, NB, Apr 1; La Haute-Gaspésie, QC, Mar 31. Most sap days a season: Pocahontas County, WV, 67; Monroe County, WV, 62; Doddridge County, WV, 60. Maple taps in the latest (US 2022, Canada 2021) Census of Agriculture, on a five-step scale shared by both countries: under 1,000, 1,000–5,000, 5,000–20,000, 20,000–100,000, 100,000+; the most: Témiscouata, QC (5,062,870), Le Granit, QC (5,056,082), Les Appalaches, QC (3,508,831), Beauce-Sartigan, QC (2,866,417), L'Islet, QC (2,826,410). Maple farms in the same census, in five steps: under 10, 10–20, 20–50, 50–100, 100+; the most: Les Appalaches, QC (576), Beauce-Sartigan, QC (538), Le Granit, QC (519). Syrup made, in US gallons: Le Granit, QC (≈ 2.3 million gal), Témiscouata, QC (≈ 2 million gal), Les Appalaches, QC (≈ 1.4 million gal). Quebec figures are PPAQ pounds converted at 11.1 lb per US gallon (the density of finished syrup). Tappable maples (FIA estimates of sugar maples 10 in and up on forest land, US counties only): under 1 million, 1–2 million, 2–5 million, 5–10 million, 10 million+; the most: Hamilton County, NY (about 15 million ± 11%), Essex County, NY (about 14 million ± 12%), Iron County, MI (about 13 million ± 14%). 126 counties' estimates are too uncertain to show (sampling error over 50%). 31 counties have none tallied on the inventory plots (not a zero). Canadian divisions have no official count. 54 places show an earlier census figure (dotted) because the latest was withheld; those figures don’t set the bins. Each shaded place links to its page; every state and province page lists its places in a table.
Hover or tap a place for its taps, farms, syrup, tappable maples, season and sap days, then click through to its page. US counties use the 2022 Census of Agriculture (USDA), Canadian divisions the 2021 one (Statistics Canada). Syrup made comes from the same US census and, in Quebec, the PPAQ’s 2026 estimate (published in pounds); both countries read on one scale, in US gallons, litres or pounds, and a converted figure is marked ≈ with the original beside it. Tappable maples are the USDA Forest Service’s estimate of sugar maples 10 inches and up on forest land, shown only where the sampling error is 50% or less (cross-hatched where it is higher); Canada publishes no such count. Hatched places had a figure withheld; dotted ones show an earlier census’s figure, labelled with its year, because the latest was withheld; grey places reported fewer than five maple farms.
United States · 385 counties in 17 states
Pick a state
13 county pages
Vermont
8,499,720 taps · led by Franklin County
USDA season median Mar 2 – Apr 12
53 county pages
New York
2,903,758 taps · led by Clinton County
USDA season median Feb 28 – Apr 5
16 county pages
Maine
1,946,642 taps · led by Somerset County
USDA season median Mar 4 – Apr 11
53 county pages
Wisconsin
1,272,963 taps · led by Marathon County
USDA season median Mar 15 – Apr 9
35 county pages
Pennsylvania
918,865 taps · led by Somerset County
USDA season median Feb 25 – Mar 28
64 county pages
Michigan
640,649 taps · led by Menominee County
USDA season median Mar 5 – Apr 7
10 county pages
New Hampshire
566,187 taps · led by Sullivan County
USDA season median Feb 28 – Apr 7
49 county pages
Ohio
468,579 taps · led by Geauga County
USDA season median Feb 18 – Mar 27
6 county pages
Massachusetts
255,805 taps · led by Franklin County
USDA season median Feb 24 – Apr 3
17 county pages
Indiana
107,234 taps · led by LaGrange County
USDA season median Feb 10 – Mar 12
29 county pages
Minnesota
97,822 taps · led by Chisago County
USDA season median Mar 6 – Apr 6
8 county pages
Connecticut
87,320 taps · led by Litchfield County
USDA season median Feb 12 – Mar 26
16 county pages
West Virginia
71,699 taps · led by Preston County
USDA season median Feb 4 – Mar 12
6 county pages
Iowa
23,903 taps · led by Chickasaw County
6 county pages
Kentucky
12,206 taps · led by Crittenden County
4 county pages
Illinois
7,756 taps · led by Whiteside County
State totals only
Missouri
3,091 taps · led by Cape Girardeau County


Top ten
The biggest maple counties
- 1Franklin County, VT2,436,351 taps
- 2Somerset County, ME1,685,551 taps
- 3Lamoille County, VT1,113,960 taps
- 4Orleans County, VT911,598 taps
- 5Chittenden County, VT746,287 taps
- 6Addison County, VT728,236 taps
- 7Essex County, VT586,750 taps
- 8Orange County, VT440,188 taps
- 9Rutland County, VT375,147 taps
- 10Clinton County, NY365,777 taps
First and last
Where the season starts earliest, and latest
Earliest
Harrison County, Indiana
Sap usually runs January 14 – February 13 at Corydon; 44.2 sap days a season.

Latest
Douglas County, Wisconsin
Sap usually runs March 29 – April 18 at Superior; 25.8 sap days a season.

That is a spread of about 11 weeks from the warm edge of the maple belt to the cold one, which is why “when to tap” needs a county answer, not a national one.
USDA Forest Inventory · 17 states
How many maples are big enough to tap?
The Forest Service counts about 908 million sugar maples 10 inches and up on forest land across the 17 atlas states, out of about 959 million in the whole country.
- Sugar, 10 in+
- 908M
- ±1.3% sampling error
- Red, 10 in+
- 1.18B
- ±1.1% sampling error
- Sugar, 18 in+
- 107M
- ±2.5% sampling error
- 17-state sugar maples: ±1.3% sampling error (896–919 million) · tallied on 7,992 plots. One combined estimate from FIA’s 84,890 plots in the 17 states, measured 2016–2025.
- FIA counts trees on forest land only. Yard, street and farm trees are not counted, so true numbers are higher.
- FIA visits a different share of its plots each year, so each state’s figure pools its latest 5 to 9 years of visits. How FIA counts trees →
The ten counties with the most sugar maples, 10 in and up
- 1Hamilton County, NY15M±11%
- 2Essex County, NY14M±12%
- 3Iron County, MI13M±14%
- 4Aroostook County, ME13M±11%
- 5Gogebic County, MI13M±12%
- 6Coos County, NH12M±15%
- 7Forest County, WI12M±10%
- 8Ontonagon County, MI11M±15%
- 9Baraga County, MI11M±17%
- 10Marquette County, MI11M±16%
County estimates with a sampling error of 50% or less only, ranked by FIA’s point estimate; ranks whose ranges overlap could swap. Big, heavily forested counties lead.
Taps, trees and farms
How hard the belt taps its maples
247 counties · 17 states · Census 2022 × Forest Inventory
How many tappable maples get tapped?
One tap per this many forest sugar maples
- Vermont8,499,720 taps1 per 8.4
- Maine1,946,642 taps1 per 25
- Massachusetts255,805 taps1 per 42
- New Hampshire566,187 taps1 per 45
- Connecticut87,320 taps1 per 59
- New York2,903,758 taps1 per 60
- Wisconsin1,272,963 taps1 per 72
- Pennsylvania918,865 taps1 per 88
- Ohio468,579 taps1 per 97
- Iowa23,903 taps1 per 130
- Minnesota97,822 taps1 per 240
- Michigan640,649 taps1 per 260
- Indiana107,234 taps1 per 290
- West Virginia71,699 taps1 per 860
- Illinois7,756 taps1 per 1,200
- Missouri3,091 taps1 per 3,300
- Kentucky12,206 taps1 per 3,800
Longer bar = more taps for the trees on hand. States ranked from the most tapped.
County by county (247 of 758 with both figures)
5 counties with a withheld 2022 tap count show the 2017 count on the maps; they aren’t charted against 2022. A rough comparison of two different sources. Taps are the 2022 Census of Agriculture’s count (USDA NASS); trees are the Forest Service’s estimate of sugar maples 10 in and up on forest land (FIA, only estimates with a sampling error of 50% or less). FIA counts trees on forest land only. Yard, street and farm trees are not counted, so true numbers are higher. Taps can also be on red maples and other species, and a big tree can carry two. So read it as how hard each place leans on its forest sugar maples, not as a share of trees tapped. How FIA counts trees →
See the numbers ↓See the numbers ↑
| State | Taps | Sugar maples | Sampling error | Trees per tap |
|---|---|---|---|---|
| Vermont | 8,499,720 | 72 million | ±4.9% | 8.4 |
| Maine | 1,946,642 | 50 million | ±6.1% | 25 |
| Massachusetts | 255,805 | 11 million | ±13% | 42 |
| New Hampshire | 566,187 | 25 million | ±8.3% | 45 |
| Connecticut | 87,320 | 5.2 million | ±15% | 59 |
| New York | 2,903,758 | 175 million | ±3.1% | 60 |
| Wisconsin | 1,272,963 | 92 million | ±3.3% | 72 |
| Pennsylvania | 918,865 | 81 million | ±4.6% | 88 |
| Ohio | 468,579 | 46 million | ±6.0% | 97 |
| Iowa | 23,903 | 3.2 million | ±25% | 130 |
| Minnesota | 97,822 | 23 million | ±6.5% | 240 |
| Michigan | 640,649 | 166 million | ±3.7% | 260 |
| Indiana | 107,234 | 31 million | ±6.3% | 290 |
| West Virginia | 71,699 | 62 million | ±4.7% | 860 |
| Illinois | 7,756 | 9.4 million | ±11% | 1,200 |
| Missouri | 3,091 | 10 million | ±9.6% | 3,300 |
| Kentucky | 12,206 | 47 million | ±4.4% | 3,800 |
446 counties · 17 states · Census 2022
How big is a sugarbush? Taps per farm, county by county
State median of its counties
See the numbers ↓See the numbers ↑
| State | Counties | Median county | Statewide | Largest county |
|---|---|---|---|---|
| Vermont | 12 | 5,864 | 5,931 | Essex (21,731) |
| New York | 50 | 1,148 | 1,963 | Clinton (5,715) |
| Massachusetts | 7 | 800 | 980 | Franklin (1,747) |
| New Hampshire | 10 | 785 | 1,202 | Sullivan (5,057) |
| Maine | 16 | 453 | 3,981 | Somerset (16,525) |
| Michigan | 64 | 430 | 681 | Mackinac (5,827) |
| Connecticut | 8 | 430 | 460 | Tolland (972) |
| Pennsylvania | 41 | 322 | 1,480 | Crawford (3,754) |
| Wisconsin | 59 | 273 | 944 | Forest (4,888) |
| Ohio | 58 | 210 | 514 | Knox (1,717) |
| Indiana | 28 | 197 | 343 | Orange (1,038) |
| Minnesota | 32 | 138 | 269 | Hennepin (600) |
| Missouri | 5 | 57 | 69 | Cape Girardeau (269) |
| West Virginia | 22 | 56 | 358 | Preston (1,466) |
| Kentucky | 13 | 53 | 125 | Crittenden (419) |
| Iowa | 12 | 35 | 275 | Chickasaw (655) |
| Illinois | 9 | 13 | 112 | Whiteside (60) |
Canada
143 census divisions in four provinces
83 divisions
Quebec
48,672,648 taps · led by Témiscouata
Producers' record Mar 14 – Apr 18
10 divisions
New Brunswick
3,523,948 taps · led by Restigouche
Weather estimate Mar 27 – Apr 27
43 divisions
Ontario
2,013,549 taps · led by Waterloo
Weather estimate Mar 12 – Apr 12
7 divisions
Nova Scotia
420,383 taps · led by Cumberland
Weather estimate Mar 15 – Apr 17


Top ten
The biggest maple divisions
- 1Témiscouata, QC5,062,870 taps
- 2Le Granit, QC5,056,082 taps
- 3Les Appalaches, QC3,508,831 taps
- 4Beauce-Sartigan, QC2,866,417 taps
- 5L'Islet, QC2,826,410 taps
- 6Bellechasse, QC2,161,913 taps
- 7L'Érable, QC2,139,113 taps
- 8Restigouche, NB2,102,766 taps
- 9Arthabaska, QC1,745,283 taps
- 10Les Etchemins, QC1,738,699 taps
Reading the Canadian pages
What's different north of the border
Farms and taps, no gallons
Statistics Canada doesn't publish syrup volume by census division, so each page shows farms and taps for 2021 and 2016.
Two sources in Quebec
67 of the 83 Quebec pages add the PPAQ's 2026 regional fact sheet, shown separately and never added to the census.
Anchored dates in Quebec
Quebec's typical dates are anchored to producers' reported season (Houle et al. 2015). Ontario and the Maritimes get weather estimates.
35 seasons, in °C
Daily Daymet temperatures 1991–2025, Celsius first, and the Environment Canada forecast.
How it's built
Three public datasets, joined by county: USDA's 2022 Census of Agriculture (farms, taps, gallons, 2017 and 2022), 36 seasons of daily high and low temperatures for each county seat (PRISM 4-km grid, served by NOAA’s Regional Climate Centers), and the National Weather Service forecast for this week. Each day is scored with the same freeze-thaw rule as our live forecast, and each season’s opening and closing signals come from a rule we tested against 117 state-seasons of USDA-reported dates (within 5.5 days of the reported close and 6.6 days of the opening, on average). In Canada the same rule runs on 35 seasons of Daymet temperatures (1-km grid) beside Statistics Canada's Census of Agriculture, with Quebec's typical dates anchored to producers' reported seasons (Houle et al. 2015). Method, calibration tables, limits and the CSV downloads (US and Canada) →
Sources · 9
- 1.PRISM daily temperature grids (AN81d, 4 km), accessed 2026-10-05 · PRISM Group, Oregon State University, https://prism.oregonstate.edu
- 2.Applied Climate Information System (ACIS) web services · NOAA Regional Climate Centers
- 3.USDA NASS maple syrup reports — approximate average season opened and closed dates, 2011–2022 · USDA National Agricultural Statistics Service (mirrored by the University of Vermont)
- 4.Maple taps, Census of Agriculture, 2021 (Table 32-10-0362-01) · Statistics Canada
- 5.Daymet: Daily Surface Weather Data on a 1-km Grid for North America, Version 4 R1 · ORNL DAAC
Show 4 moreShow fewer
- 6.Impacts of climate change on the timing of the production season of maple syrup in eastern Canada (PLOS ONE 10(12): e0144844, 2015) · Houle et al.
- 7.2024 U.S. Gazetteer Files — counties · U.S. Census Bureau
- 8.GeoNames gazetteer (cities500), CC BY 4.0 · GeoNames
- 9.Forest Inventory and Analysis: live trees on forest land by species and diameter (FIADB 1.9.5, EVALIDator / FIADB-API), accessed 2026-10-07 · USDA Forest Service, Forest Inventory and Analysis Program
Licences and attribution
- Adapted from Statistics Canada, Census of Agriculture 2021, 2016 and 2011 (Tables 32-10-0362-01 and 32-10-0423-01), 2021 Census population and dwelling counts (Tables 98-10-0002-01 and 98-10-0011-01) and 2021 Census cartographic boundary files. This does not constitute an endorsement by Statistics Canada of this product.
- Contains information licensed under the Open Government Licence – Canada.
- Thornton, M.M., R. Shrestha, Y. Wei, P.E. Thornton, S-C. Kao, and B.E. Wilson. 2022. Daymet: Daily Surface Weather Data on a 1-km Grid for North America, Version 4 R1. ORNL DAAC, Oak Ridge, Tennessee, USA. https://doi.org/10.3334/ORNLDAAC/2129

LuckySap · free on iPhone & Android
Your county's sap days, on your phone
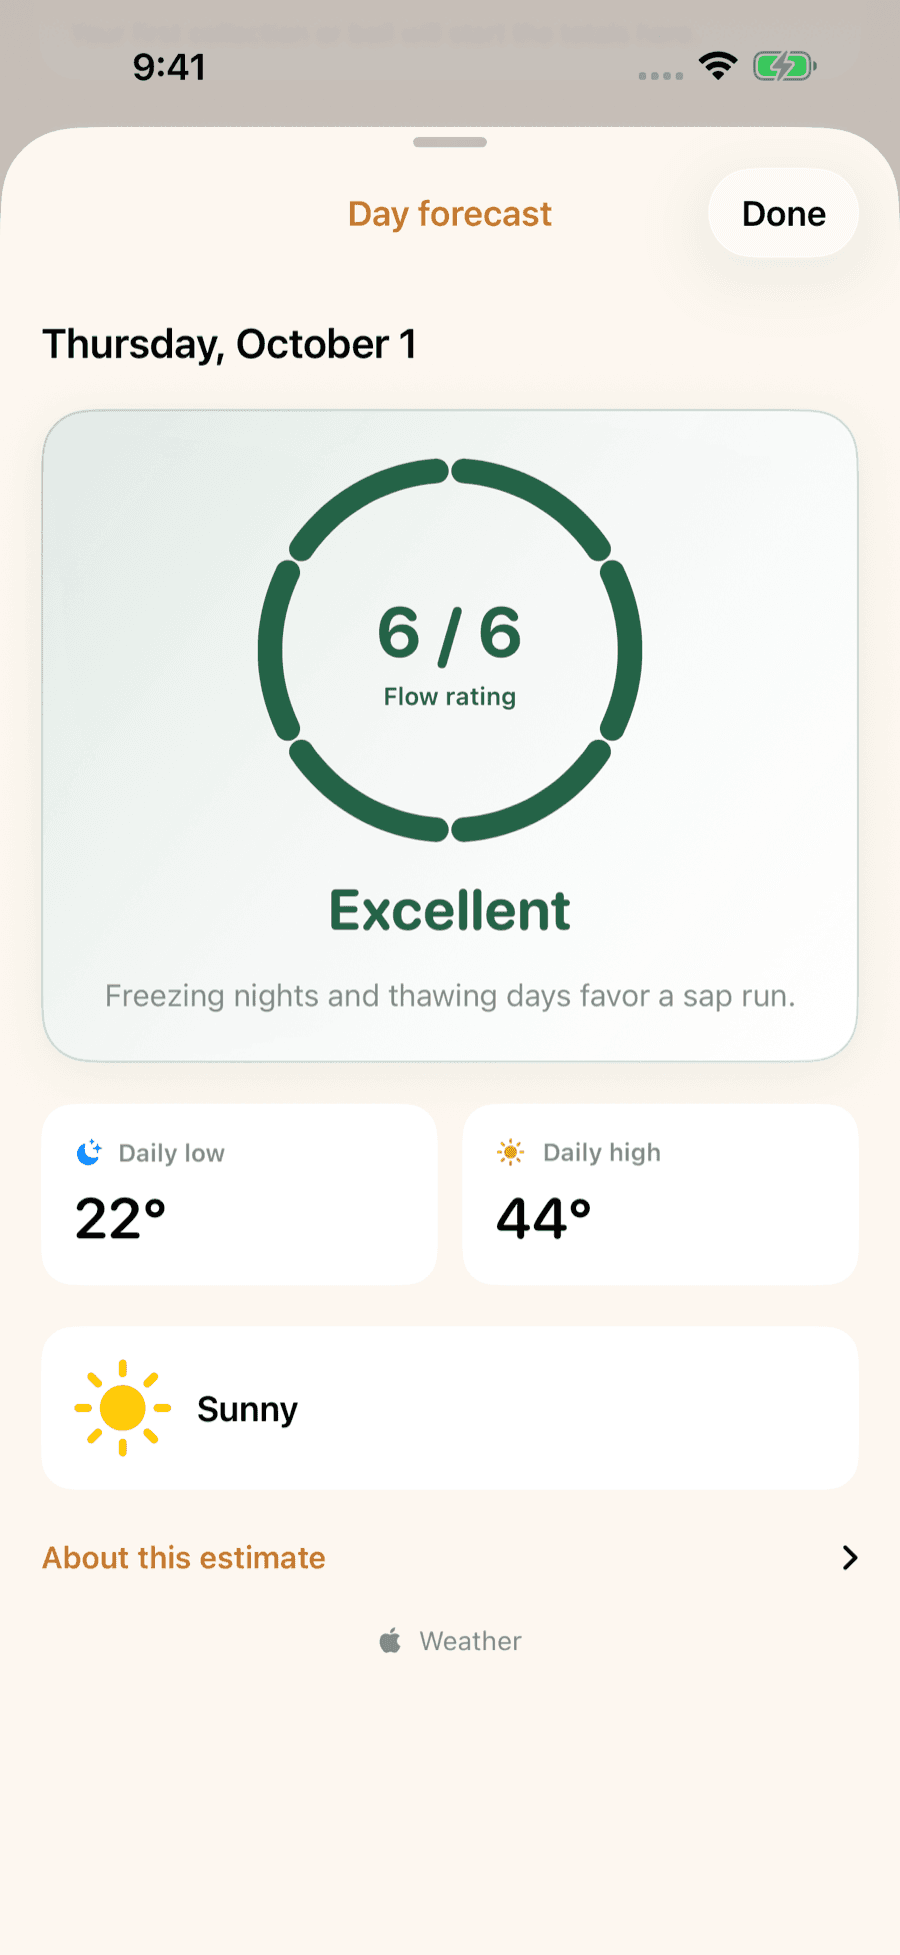
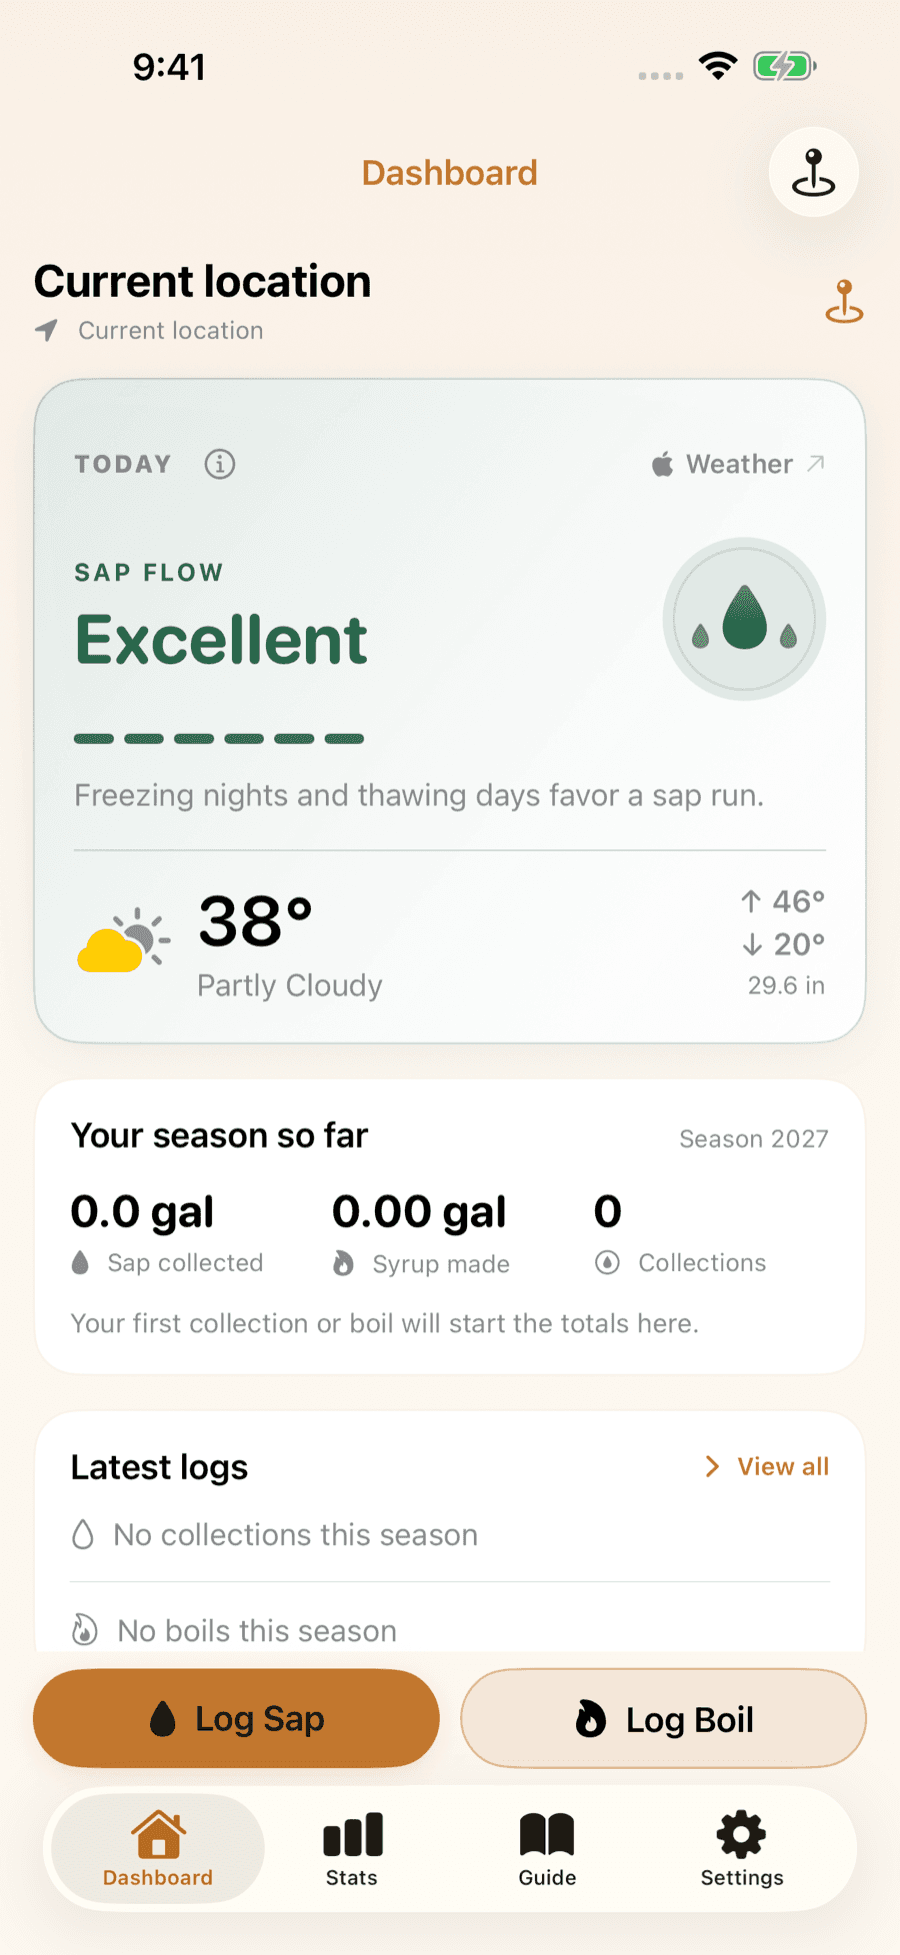
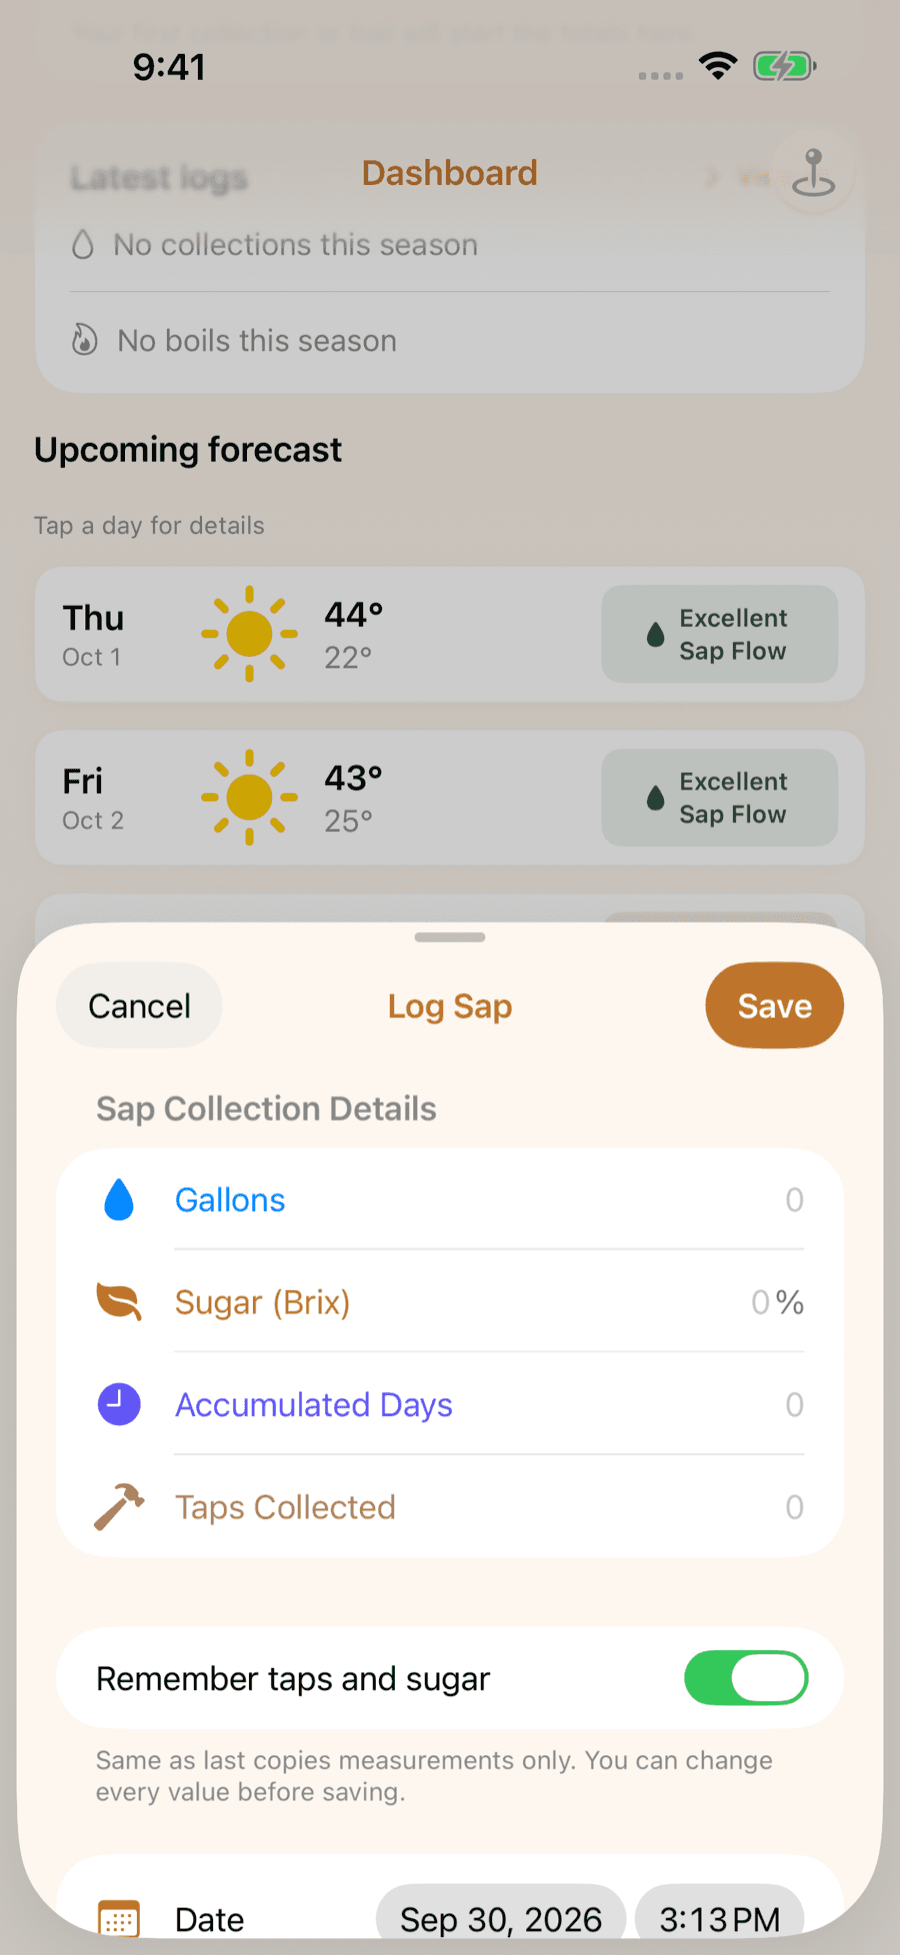
LuckySap turns the forecast for your trees into a day-by-day sap outlook and can ping you the night before a strong run. Free on iPhone and Android.