Skip to content
LuckySap
Free · for sugarhouses, newsrooms and extension offices

Put the sap forecast, maple maps and charts on your website

A live sap-flow outlook for your sugarbush, an interactive maple map, or any of our sourced charts on the season, production and prices. Pick one, copy the code, paste it into your site.

Live, every three hours

The sap forecast widget

Pick the spot, copy the code, paste it into your site or your maple association’s season page.
Temperatures
Your embed code

Live preview

What the widget shows

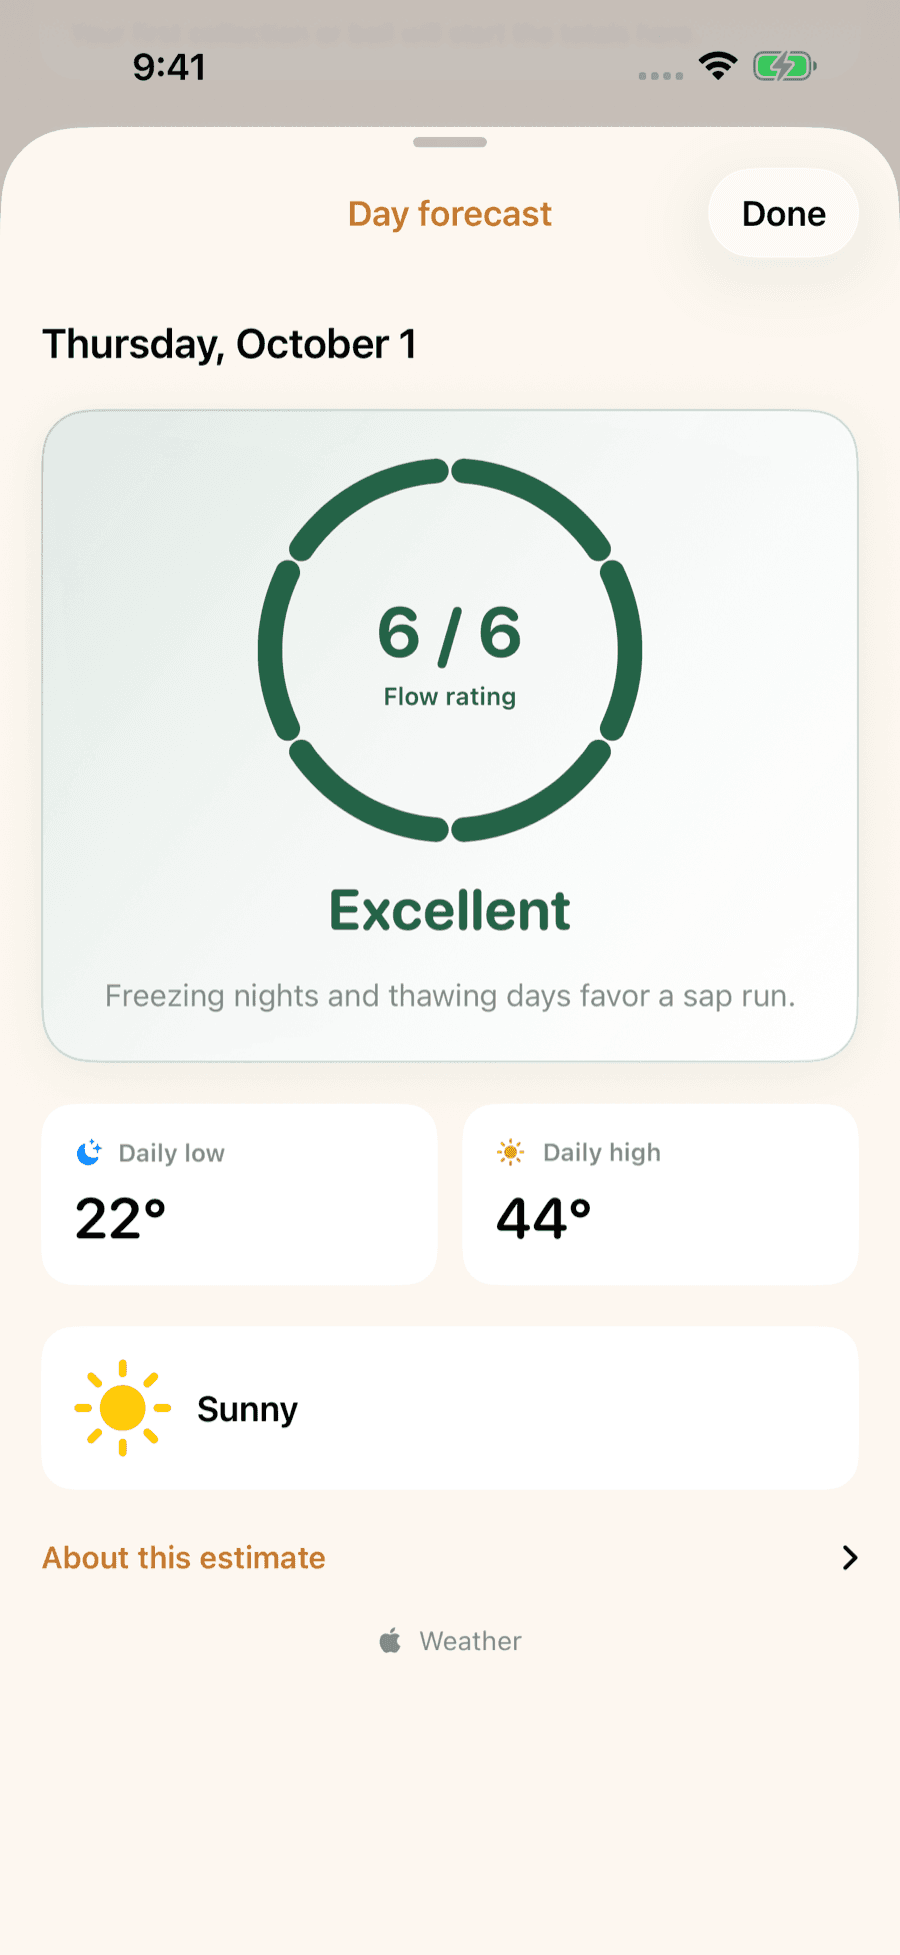
The next six to seven days with each day’s overnight low and afternoon high, hours below and above freezing, and one of the six calls our sap forecast makes (classic sap day, sap likely, maybe a light run, run tapering, little thaw, no refreeze). The rule is the one from field research: a night under 30.2 °F followed by a day over 37.4 °F. It is the same model behind the LuckySap app and the county atlas.

Free · sourced · 21 state and province maps too

Interactive maple maps

The County Maple Atlas map, the season-opening map and the price map, as live maps your readers can zoom, switch and hover. Every state and province map is here too: pick one under the atlas map. A click on a place opens its page in a new tab.

Maps

The maple atlas map of the United States and Canada: taps, farms, syrup and season by county

Every atlas county and Canadian census division on one map. Readers switch between taps, farms, syrup made, syrup per tap, tappable maples, season opening, sap days and the sap wave.

Data: USDA NASS, Statistics Canada, PPAQ, USDA Forest Service, PRISM, Daymet · English · Français

Open the embed ↗

When maple season opens, county by county, across the United States and Canada

The typical opening date of every atlas county and Canadian division, with a play button that rolls the sap wave north week by week.

Data: USDA NASS, Statistics Canada, PPAQ, USDA Forest Service, PRISM, Daymet · English · Français

Open the embed ↗

Maple syrup prices by state: what producers were paid per gallon in 2025

USDA’s state prices on one map, switchable between all sales, retail, wholesale and bulk; each state’s card has all four.

Data: USDA NASS · English

Open the embed ↗

Each map links back to its page on this site, where the notes, tables and every source live. Every embeddable map also has an “Embed” button under it.

Free · sourced · 4 in French too

Maple data charts for your story or site

The same interactive charts as our production, price and season pages, with their sources and a credit line built in. Hover or tap works inside the embed; it fits any column from phone width up.

When the season runs

How far north, how much later: maple season opening date by latitude

Every atlas county and Canadian division’s typical opening date against its latitude, with the days-per-degree line.

Data: PRISM, USDA NASS, Daymet · English · Français

Open the embed ↗

Maple season opening dates by state, 2011–2022

Every USDA-reported season on one strip: states down the side, years across, shaded by the day sugaring opened.

Data: USDA NASS · English

Open the embed ↗

Production

US maple syrup production, 1992–2026

The published US total and the like-for-like seven states NASS has surveyed every year, with the coverage break shaded.

Data: USDA NASS · English

Open the embed ↗

US maple syrup yield per tap, 2001–2026

Gallons of syrup per tap across the surveyed states, with the record year marked.

Data: USDA NASS · English

Open the embed ↗

Maple syrup production rank by state, 1992–2026

Who makes the most syrup, year by year: a bump chart of every state’s production rank.

Data: USDA NASS · English

Open the embed ↗

Does a longer season mean more syrup?

USDA season length against gallons per tap, one dot per state and year, with the least-squares line.

Data: USDA NASS · English

Open the embed ↗

A hundred years of Canadian maple syrup, 1924–2025

Canada’s maple crop every year since the 1920s, in imperial gallons, litres or US gallons, with the records marked.

Data: Statistics Canada · English · Français

Open the embed ↗

Canada vs the US: shares of maple syrup output by volume

Each country’s share of combined Canadian and US maple syrup, year by year, with the US peak marked.

Data: Statistics Canada, USDA NASS · English · Français

Open the embed ↗

Prices

US maple syrup price per gallon, 1992–2025, before and after inflation

What producers were paid for a gallon, all sales, as paid and in today’s dollars.

Data: USDA NASS, BLS · English

Open the embed ↗

Big crop, cheap syrup? Crop size against price in Québec and the US

Connected scatters through time: Québec’s crop against its bulk price, and US production against the average price.

Data: PPAQ, USDA NASS · English · Français

Open the embed ↗

Taps, trees and farms

How many tappable maples get tapped? Census taps against forest sugar maples

Trees per tap by state, and every county on a log–log scatter: Census taps against Forest Service sugar maples.

Data: USDA NASS Census, USDA Forest Service FIA · English

Open the embed ↗

How big is a sugarbush? Taps per farm, county by county

Taps per farm in every atlas county, one strip per state, from the Census of Agriculture.

Data: USDA NASS Census of Agriculture · English

Open the embed ↗

Sugarhouse math

The sap-to-syrup curve: gallons of sap per gallon of syrup by sugar content

How fast thin sap costs you, with each maple’s typical sap sugar shaded on the curve.

Data: UVM Proctor Maple Research Center · English

Open the embed ↗

Each embed links back to the chart’s home section, where the full notes, the numbers table and every source live. Every chart also has an “Embed” button on its own page.

FAQ

Embed questions

What does it cost?
Nothing. The widget and the charts stay free and carry a small LuckySap credit with a link back; that is the whole deal.
How often does the forecast update?
Every three hours, from the National Weather Service in the US and Environment and Climate Change Canada in Canada, scored with the same freeze-thaw rule as our sap forecast pages.
Can I show Celsius?
Yes: add &unit=C to the forecast widget’s URL. Canadian locations default to the ECCC forecast; the unit is up to you.
Can I use the charts and maps in a news story, newsletter or extension page?
Yes. Embed them free with the credit line under the chart or map left in place. Every one names its official sources, and the ones that show Statistics Canada data (map boundaries included) print its Open Licence line.
Do embedded charts change?
When an agency publishes new figures and we update the site, the embedded chart updates itself. The link and the code stay the same, so nothing on your page breaks.
Do the embeds track my visitors?
No. The forecast widget, the charts and the maps load no analytics and set no cookies. Their links open getluckysap.com in a new tab.

LuckySap · free on iPhone & Android

Log every run. Know your season.

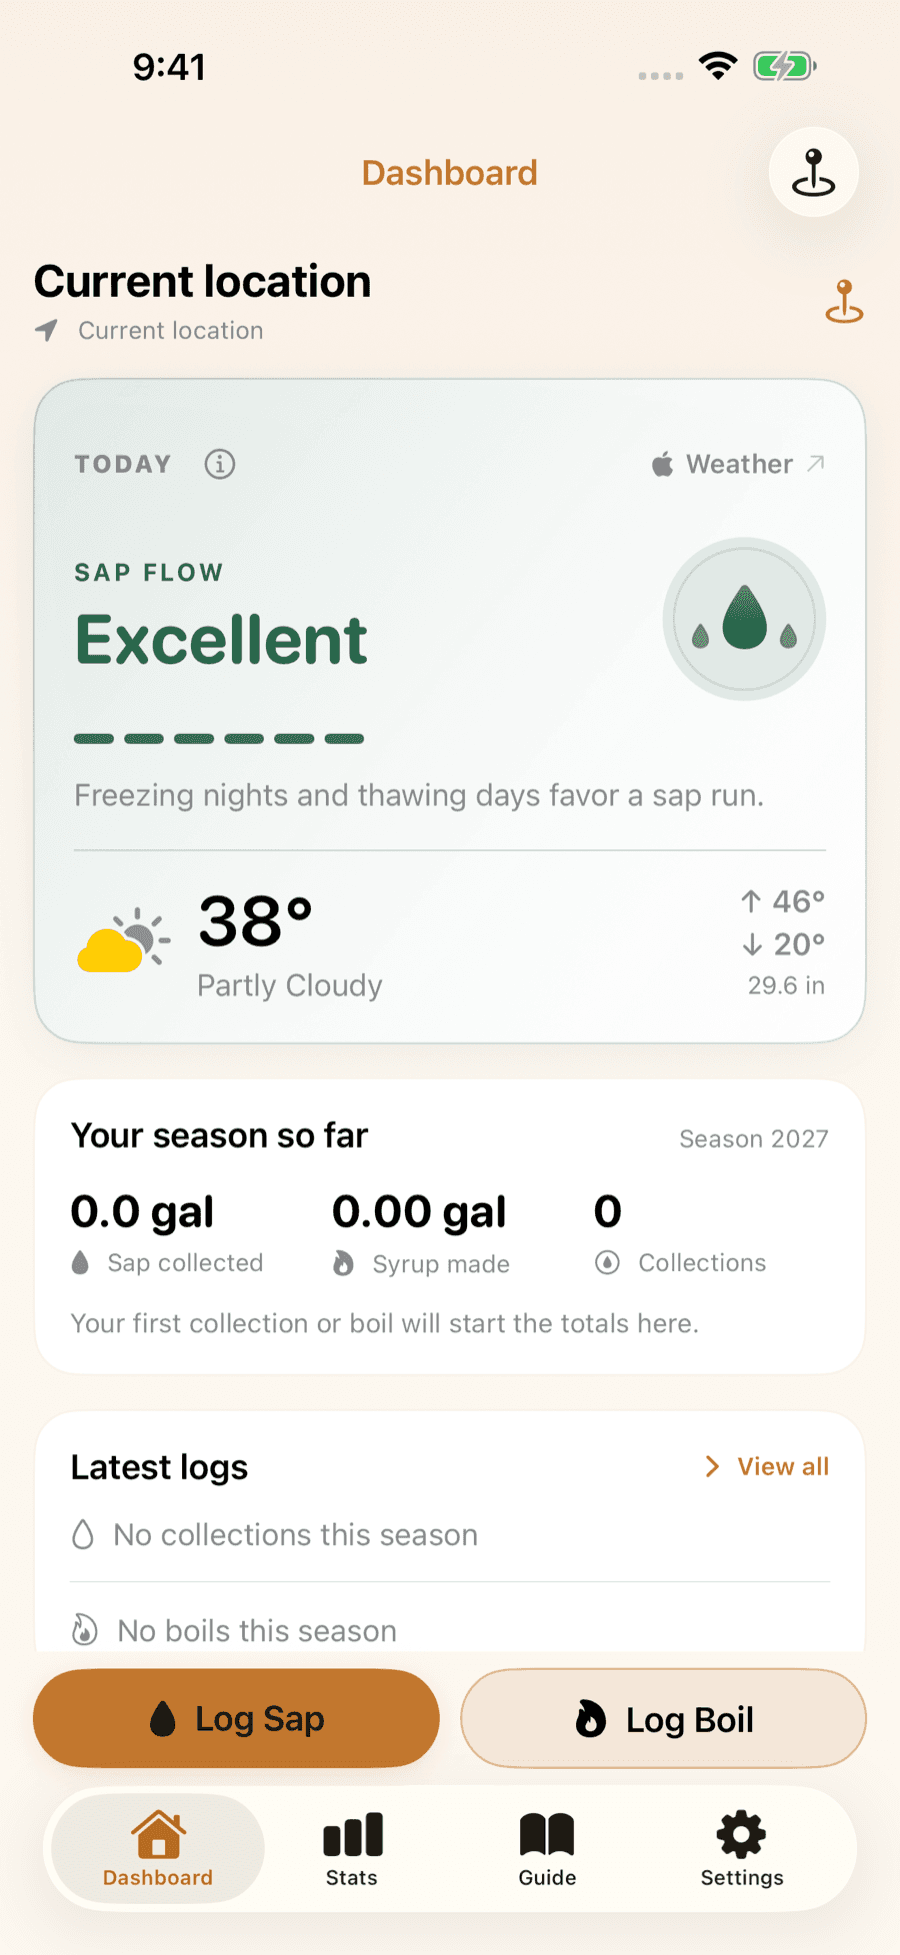
LuckySap is the maple syrup tracker for iPhone and Android: a sap-flow outlook for your trees, a quick log for every collection and boil, and season stats you can compare year to year.

Download on the App StoreGet it on Google Play