When to tap maple trees, state by state
Try St. Albans, Lindsay or Le Granit.
The sap wave
Watch the season roll north
Every county and census division with an atlas page (385 in the US, 143 in Canada), shaded by its typical opening date. Press play to watch sap days spread week by week, from December to May.
Loading the map…
Typical opening date of the sap season
- before Feb 1
- Feb 1–14
- Feb 15–28
- Mar 1–14
- Mar 15 or later
- fewer than 5 maple farms
528 places with an atlas page. Typical season opening, earliest: Harrison County, IN, Jan 14; Crittenden County, KY, Jan 15; Hardin County, KY, Jan 17; latest: Restigouche, NB, Apr 2; Gloucester, NB, Apr 1; La Haute-Gaspésie, QC, Mar 31. Most sap days a season: Pocahontas County, WV, 67; Monroe County, WV, 62; Doddridge County, WV, 60. Maple taps in the latest (US 2022, Canada 2021) Census of Agriculture, on a five-step scale shared by both countries: under 1,000, 1,000–5,000, 5,000–20,000, 20,000–100,000, 100,000+; the most: Témiscouata, QC (5,062,870), Le Granit, QC (5,056,082), Les Appalaches, QC (3,508,831), Beauce-Sartigan, QC (2,866,417), L'Islet, QC (2,826,410). Maple farms in the same census, in five steps: under 10, 10–20, 20–50, 50–100, 100+; the most: Les Appalaches, QC (576), Beauce-Sartigan, QC (538), Le Granit, QC (519). Syrup made, in US gallons: Le Granit, QC (≈ 2.3 million gal), Témiscouata, QC (≈ 2 million gal), Les Appalaches, QC (≈ 1.4 million gal). Quebec figures are PPAQ pounds converted at 11.1 lb per US gallon (the density of finished syrup). Tappable maples (FIA estimates of sugar maples 10 in and up on forest land, US counties only): under 1 million, 1–2 million, 2–5 million, 5–10 million, 10 million+; the most: Hamilton County, NY (about 15 million ± 11%), Essex County, NY (about 14 million ± 12%), Iron County, MI (about 13 million ± 14%). 126 counties' estimates are too uncertain to show (sampling error over 50%). 31 counties have none tallied on the inventory plots (not a zero). Canadian divisions have no official count. 54 places show an earlier census figure (dotted) because the latest was withheld; those figures don’t set the bins. Each shaded place links to its page; every state and province page lists its places in a table.
Hover or tap a place for its typical season, sap days and taps, then open its page. Dates come from daily temperatures at each place, scaled to the reported state and provincial seasons; a “sap day” is a freeze-thaw day. Any single year can be weeks early or late.
385 US counties · 143 Canadian divisions
How far north, how much later: about 5.6 days per degree
- US county
- Canadian division
- Least-squares line: 5.6 days per degree
See the numbers ↓See the numbers ↑
| State / province | Places | Latitude | Median opening | Earliest – latest |
|---|---|---|---|---|
| Kentucky | 6 | 37.3–39.1°N | Jan 21 | Jan 15 – Jan 29 |
| West Virginia | 16 | 37.6–39.5°N | Feb 5 | Jan 26 – Feb 18 |
| Connecticut | 8 | 41.4–41.9°N | Feb 9 | Feb 3 – Feb 19 |
| Indiana | 17 | 38.2–41.7°N | Feb 12 | Jan 14 – Feb 16 |
| Ohio | 49 | 39.0–41.7°N | Feb 18 | Jan 31 – Feb 26 |
| Pennsylvania | 35 | 39.9–42.1°N | Feb 21 | Feb 6 – Mar 10 |
| Illinois | 4 | 40.7–42.4°N | Feb 22 | Feb 14 – Feb 26 |
| Massachusetts | 6 | 42.1–42.6°N | Feb 22 | Feb 18 – Mar 5 |
| New York | 53 | 41.0–44.8°N | Feb 24 | Feb 2 – Mar 17 |
| New Hampshire | 10 | 42.9–44.5°N | Feb 28 | Feb 16 – Mar 11 |
| Iowa | 6 | 41.7–43.3°N | Mar 1 | Feb 20 – Mar 4 |
| Vermont | 13 | 42.9–44.9°N | Mar 3 | Feb 19 – Mar 8 |
| Maine | 16 | 43.5–46.1°N | Mar 5 | Feb 20 – Mar 13 |
| Michigan | 64 | 41.9–47.1°N | Mar 5 | Feb 16 – Mar 25 |
| Minnesota | 29 | 43.7–47.5°N | Mar 5 | Feb 25 – Mar 19 |
| Ontario | 43 | 42.3–47.5°N | Mar 11 | Feb 22 – Mar 30 |
| Wisconsin | 53 | 42.8–46.7°N | Mar 14 | Mar 3 – Mar 29 |
| Nova Scotia | 7 | 44.4–45.8°N | Mar 14 | Mar 9 – Mar 19 |
| Quebec | 83 | 45.1–49.1°N | Mar 16 | Mar 5 – Mar 31 |
| New Brunswick | 10 | 45.4–48.0°N | Mar 21 | Mar 18 – Apr 2 |
The season calendar
typical open → close
Bars run from the typical opening to the typical closing date (USDA NASS medians where available; extension and provincial sources elsewhere). Any single year can be weeks early or late.
All regions
States & provinces
- West VirginiaOpens early February · closes mid-March~Feb 486 days
- IndianaOpens early February · closes mid-March~Feb 1092 days
- ConnecticutOpens mid-February · closes late March~Feb 1294 days
- OhioOpens mid-February · closes late March~Feb 18100 days
- MassachusettsOpens late February · closes early April~Feb 24106 days
- PennsylvaniaOpens late February · closes late March~Feb 25107 days
- New HampshireOpens late February · closes early April~Feb 28110 days
- New YorkOpens late February · closes early April~Feb 28110 days
- VermontOpens early March · closes mid-April~Mar 2112 days
- MaineOpens early March · closes mid-April~Mar 4114 days
- MichiganOpens early March · closes early April~Mar 5115 days
- MinnesotaOpens early March · closes early April~Mar 6116 days
- QuebecOpens mid-March · closes mid-April~Mar 14124 days
- WisconsinOpens mid-March · closes early April~Mar 15125 days
- IllinoisOpens early January (south) to mid-February (central) · closes late February (south) to mid-March (central)
- IowaOpens mid-to-late February · closes March, once buds begin to break
- KentuckyOpens late December to early January · closes late February
- MissouriOpens mid-January to early February · closes early March
- New BrunswickOpens late February to March (south first) · closes April (later in the north)
- Nova ScotiaOpens March · closes late April
- OntarioOpens February (southwest) to March (north) · closes early April


Tap by the forecast, not the calendar
The dates above are averages. What actually starts a run is a freeze-thaw swing: a night below about 30°F, then a day above about 37°F. Nights in the 20s with afternoons in the 40s are the classic sap days.
Tapholes slowly dry up and seal over, usually within 6 to 10 weeks, so tapping weeks before the real season can cost you the late runs. Get taps in a day or two before the first good stretch in the forecast.
Check it now
Is the sap running where you are?
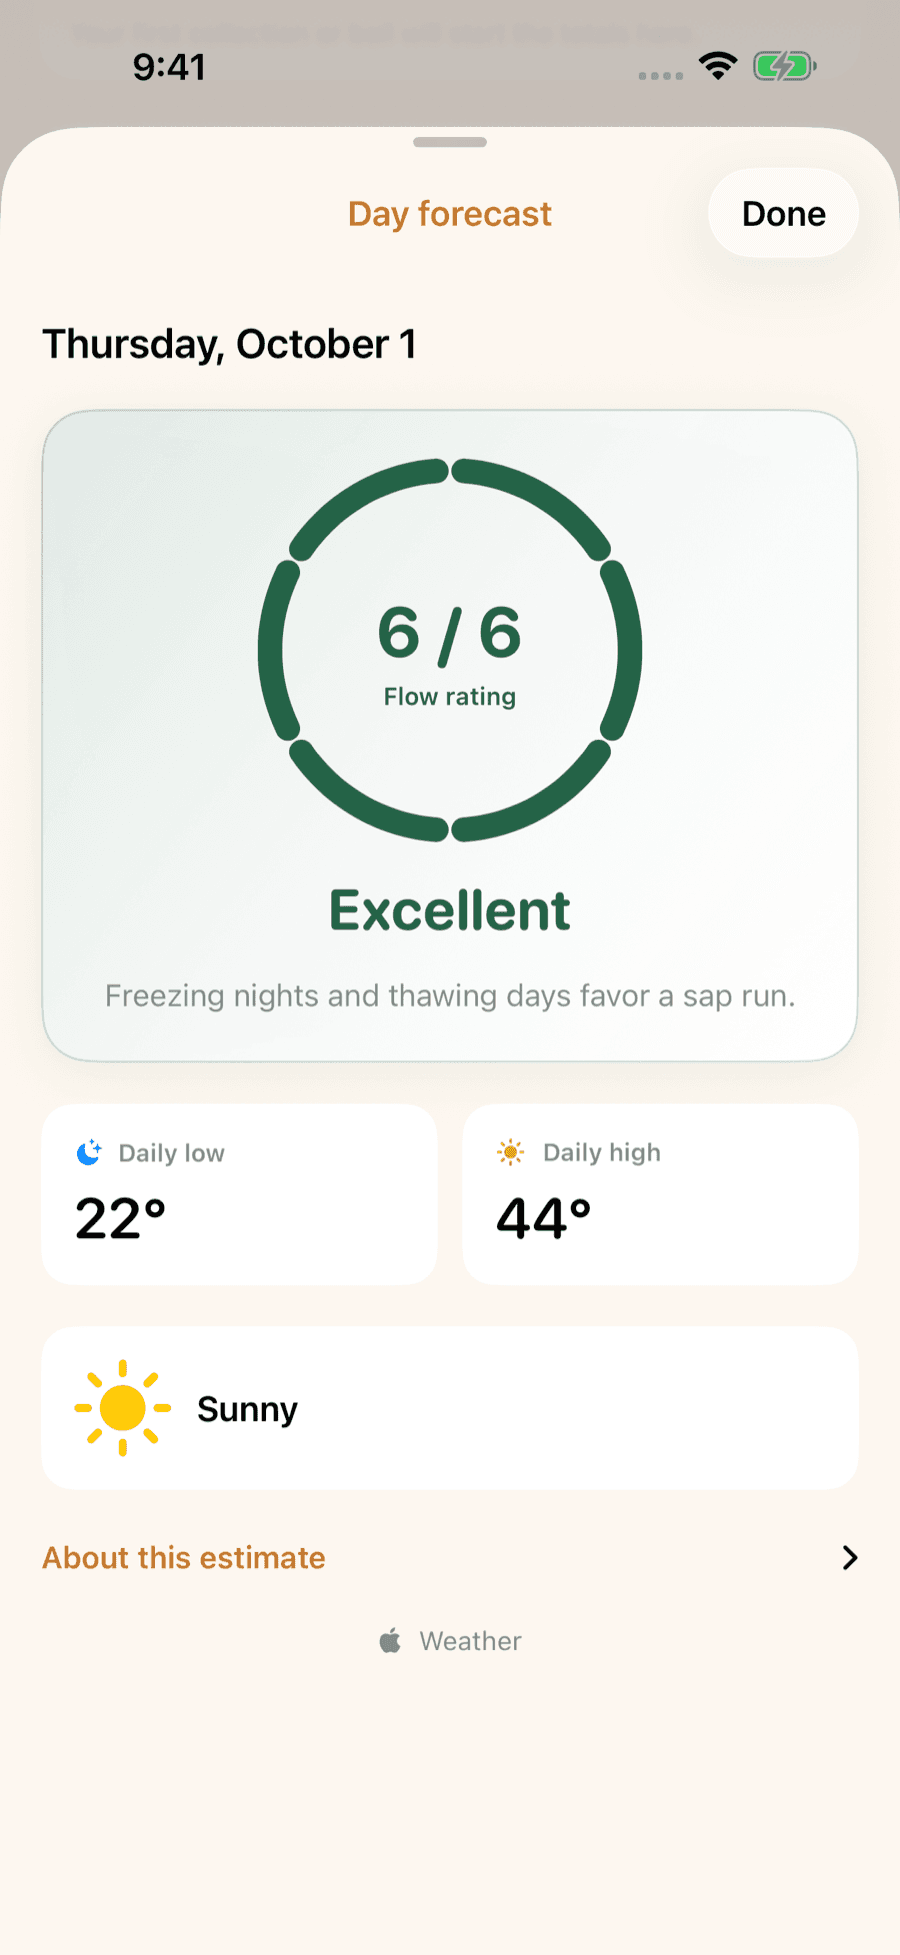
The sap forecast turns your local hourly forecast into a day-by-day outlook.
Open the sap forecast →Or browse season history, 2011–2022 →County by county
States are big. Your county has its own season.
The county maple atlas gives 385 US counties and 143 Canadian census divisions their typical dates from decades of daily temperatures, checked against the reported state and provincial seasons, plus the census farms and taps and this week’s forecast.

LuckySap · free on iPhone & Android
Log every run. Know your season.
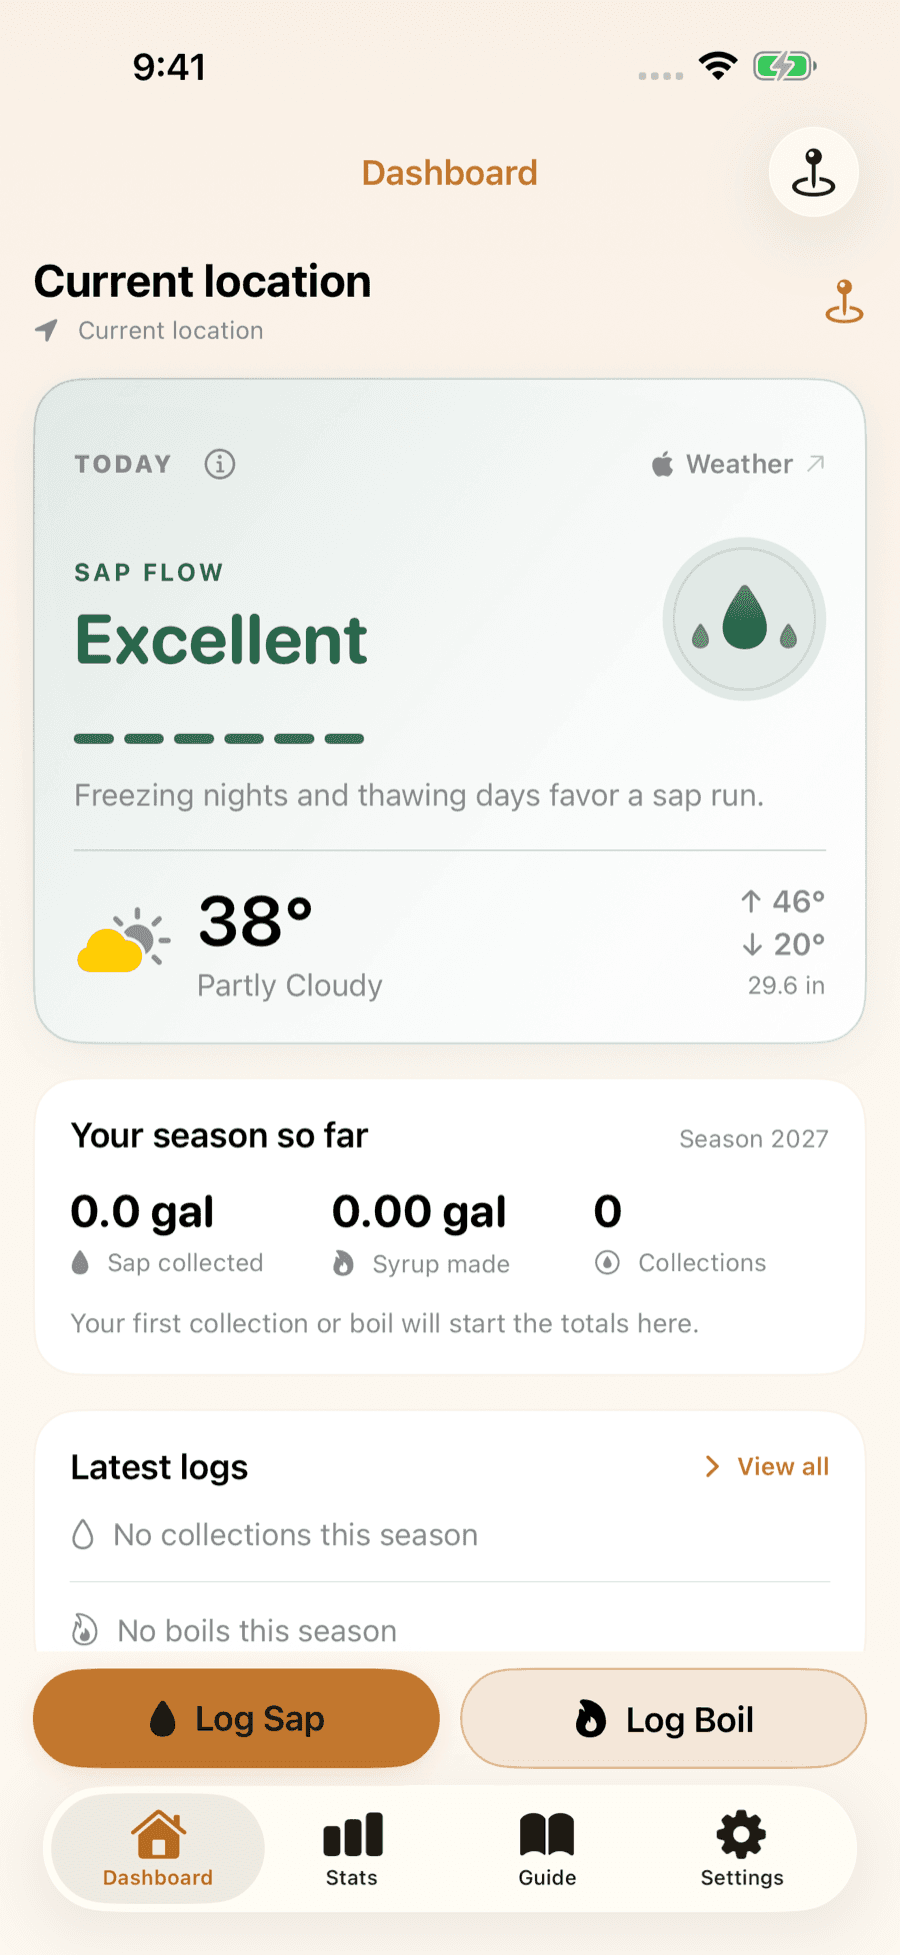
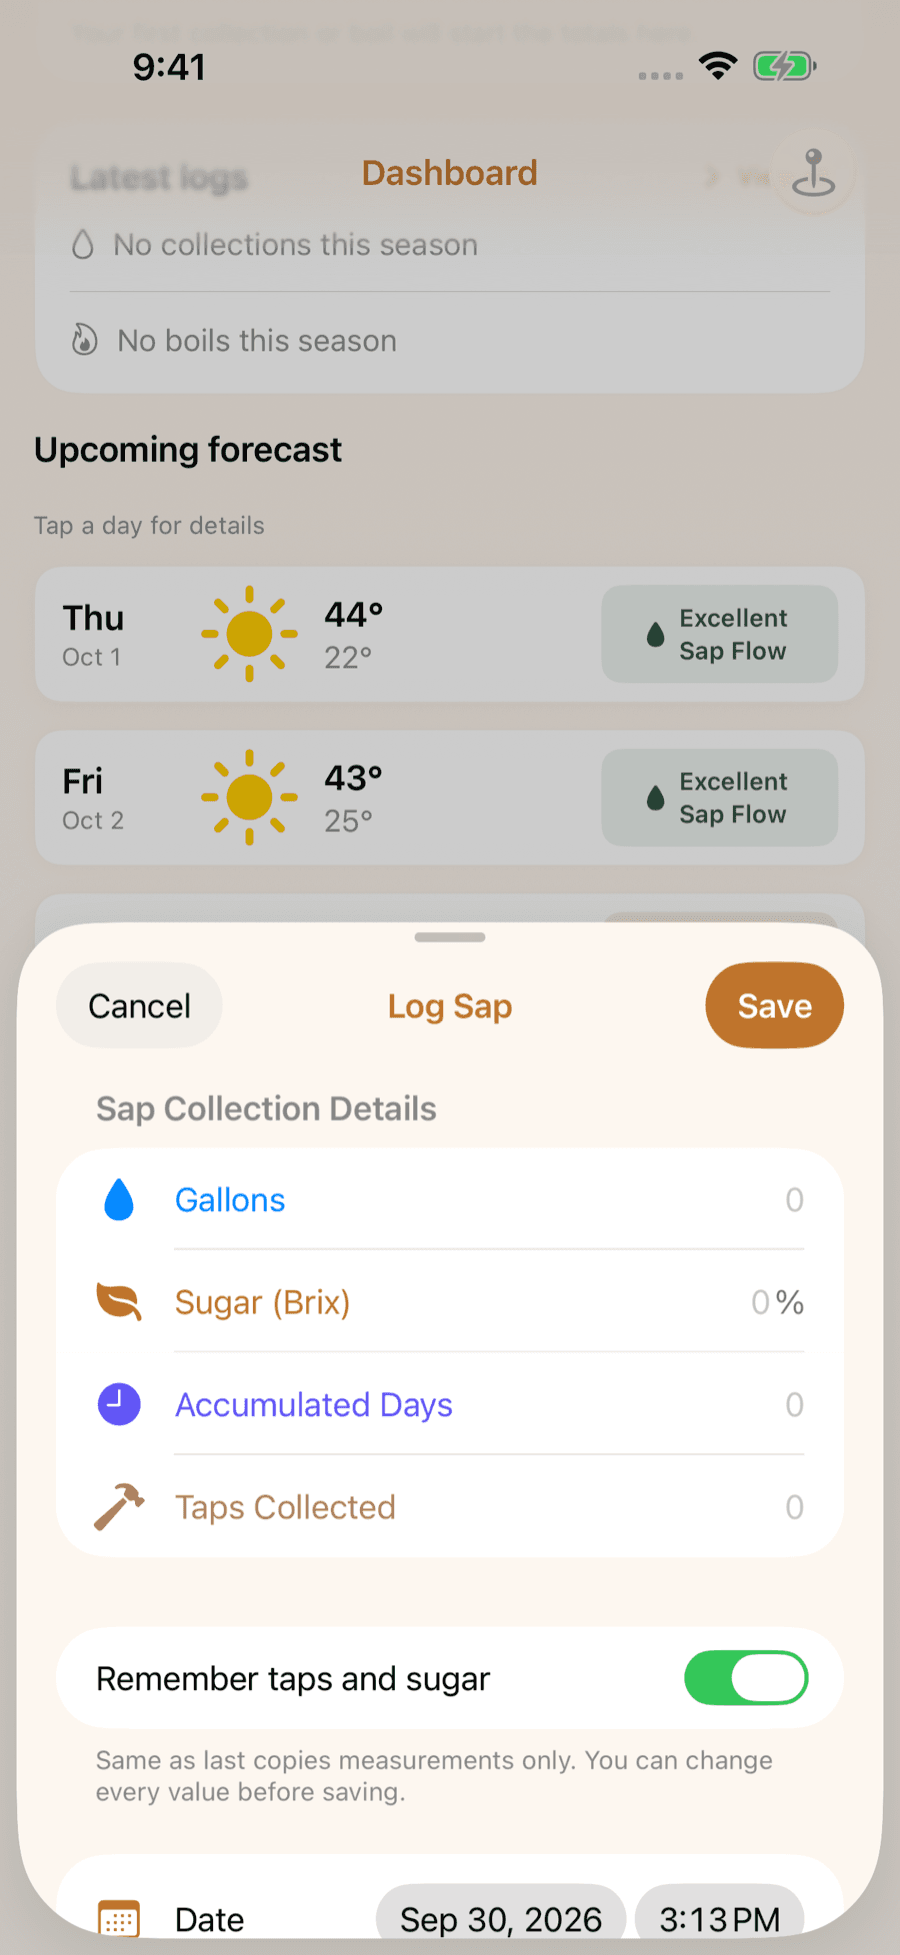
LuckySap is the maple syrup tracker for iPhone and Android: a sap-flow outlook for your trees, a quick log for every collection and boil, and season stats you can compare year to year.