Maple syrup in New York, county by county
- Maple farms, 2022
- 1,479
- -12% since 2017
- Taps, 2022
- 2.9 million
- +6% since 2017
- Gallons of syrup
- 760,198
- 0.26 gal per tap
- Counties with a page
- 53
- of 55 with maple farms
Reading the map
Where New York's sugaring happens
Clinton County alone holds 365,777 taps (13% of the state). Counties shaded lightest have the fewest taps; grey counties reported fewer than five maple farms and have no atlas page. Click any county for its season calendar.
USDA's reported New York season ran from about Feb 28 to Apr 5 in a median year (12 years of records). Our weather signal for the same counties, weighted by farms, gives Mar 4 to Apr 5; county dates below are scaled so the state matches USDA, keeping only the within-state differences.
Every county
New York maple production and season dates by county
| County | Farms | Taps | Gallons | Taps vs 2017 | Sap usually runs |
|---|---|---|---|---|---|
| Clinton | 64 | 365,777 | 79,219 | +3% | Mar 6 – Apr 9 |
| Wyoming | 57 | 320,339 | 115,220 | +10% | Feb 26 – Apr 4 |
| St. Lawrence | 106 | 277,319 | 71,351 | +34% | Mar 8 – Apr 13 |
| Lewis | 86 | 243,375 | 55,566 | +23% | Mar 10 – Apr 15 |
| Franklin | 76 | 135,217 | 23,483 | +81% | Mar 10 – Apr 16 |
| Cattaraugus | 37 | 100,515 | 15,047 | +35% | Mar 3 – Apr 8 |
| Washington | 59 | 98,989 | 27,031 | +4% | Mar 1 – Apr 8 |
| Jefferson | 30 | 84,490 | 25,460 | +63% | Mar 5 – Apr 7 |
| Steuben | 73 | 83,385 | 17,173 | -39% | Feb 26 – Apr 5 |
| Delaware | 37 | 76,806 | 20,218 | +2% | Mar 2 – Apr 8 |
| Sullivan | 23 | 76,535 | 17,288 | +3% | Feb 27 – Apr 5 |
| Otsego | 44 | 73,799 | 20,199 | -5% | Mar 1 – Apr 8 |
| Schuyler | 25 | 65,678 | 22,389 | +63% | Feb 19 – Mar 25 |
| Chautauqua | 43 | 64,688 | 16,020 | -48% | Feb 25 – Apr 2 |
| Onondaga | 22 | 58,641 | 26,740 | +56% | Feb 22 – Mar 26 |
| Allegany | 56 | 57,417 | 16,060 | -46% | Feb 27 – Apr 6 |
| Chenango | 27 | 57,185 | 15,544 | -33% | Mar 1 – Apr 7 |
| Essex | 30 | 56,746 | 20,467 | +15% | Mar 7 – Apr 12 |
| Cayuga | 14 | 52,926 | 15,173 | +17% | Feb 22 – Mar 31 |
| Fulton | 14 | 44,239 | 14,807 | +248% | Mar 4 – Apr 9 |
| Schoharie | 34 | 44,083 | 7,690 | +61% | Feb 26 – Apr 5 |
| Erie | 42 | 40,330 | 9,748 | +9% | Feb 24 – Mar 29 |
| Oneida | 35 | 33,770 | 8,602 | +11% | Feb 26 – Apr 4 |
| Orange | 9 | 30,255 | 5,510 | +227% | Feb 17 – Mar 25 |
| Oswego | 23 | 29,530 | 6,765 | +104% | Feb 26 – Mar 30 |
| Tioga | 22 | 27,738 | 7,058 | +149% | Feb 24 – Mar 31 |
| Ontario | 38 | 23,737 | 5,493 | +107% | Feb 20 – Mar 28 |
| Dutchess | 11 | 22,265 | 5,282 | — | Feb 15 – Mar 24 |
| Madison | 25 | 21,893 | 5,028 | -6% | Feb 25 – Apr 2 |
| Genesee | 15 | 17,318 | 6,292 | +10% | Feb 23 – Mar 31 |
| Cortland | 14 | 15,725 | 4,099 | -68% | Mar 1 – Apr 4 |
| Columbia | 11 | 14,953 | 6,487 | -13% | Feb 17 – Mar 26 |
| Ulster | 22 | 13,631 | 3,770 | +14% | Feb 17 – Mar 26 |
| Warren | 12 | 12,760 | 3,734 | -13% | Mar 3 – Apr 9 |
| Broome | 15 | 12,730 | 2,663 | -15% | Feb 24 – Mar 31 |
| Albany | 14 | 11,925 | 2,398 | +269% | Feb 19 – Mar 27 |
| Yates | 32 | 9,686 | 2,677 | +60% | Feb 21 – Mar 27 |
| Rensselaer | 30 | 9,302 | 2,134 | +89% | Feb 19 – Mar 27 |
| Livingston | 26 | 6,853 | 1,563 | +337% | Feb 20 – Mar 28 |
| Chemung | 9 | 6,421 | 2,157 | +42% | Feb 20 – Mar 28 |
| Wayne | 6 | 5,350 | 1,455 | +27% | Feb 21 – Mar 28 |
| Hamilton | 8 | 5,255 | 1,358 | -41% | Mar 17 – Apr 22 |
| Herkimer | 12 | 4,204 | 1,193 | -60% | Feb 27 – Apr 5 |
| Tompkins | 13 | 3,087 | 794 | -21% | Feb 19 – Mar 26 |
| Saratoga | 10 | 2,480 | 565 | -74% | Feb 23 – Mar 30 |
| Orleans | 13 | 2,227 | 165 | +4267% | Feb 21 – Mar 28 |
| Greene | 11 | 1,723 | 330 | -60% | Feb 16 – Mar 26 |
| Schenectady | 5 | 1,375 | 99 | -76% | Feb 22 – Mar 27 |
| Seneca | 9 | 1,260 | 286 | -71% | Feb 21 – Mar 26 |
| Putnam | 6 | 150 | 18 | -96% | Feb 17 – Mar 25 |
| Montgomery | 9 | withheld | withheld | — | Feb 27 – Apr 5 |
| Westchester | 6 | withheld | withheld | — | Feb 2 – Mar 10 |
| Monroe | 5 | withheld | withheld | — | Feb 20 – Mar 27 |
| Niagara | 3 | withheld | withheld | — | fewer than 5 farms · no page |
| Suffolk | 1 | withheld | withheld | — | fewer than 5 farms · no page |
| New York total | 1,479 | 2,903,758 | 760,198 | +6% | USDA median Feb 28 – Apr 5 |
“Withheld” = USDA suppressed the figure to avoid disclosing individual operations. County totals need not sum to the state total for that reason.
About this page
Production figures are copied, unchanged, from Table 37 of the 2022 Census of Agriculture county volume for New York. Season dates come from our county maple atlas: 36 seasons of daily temperatures at each county seat scored with the freeze-thaw rule behind our live forecast, calibrated against 117 state-seasons of USDA-reported dates. How the atlas is built, and the downloadable dataset →
Sources · 3
- 1.2022 Census of Agriculture, County Level Data — New York, Table 37: Maple Syrup, 2022 and 2017 · USDA National Agricultural Statistics Service
- 2.USDA NASS maple syrup reports — approximate average season opened and closed dates, 2011–2022 · USDA National Agricultural Statistics Service (mirrored by the University of Vermont)
- 3.PRISM daily temperature grids (AN81d, 4 km), accessed 2026-10-05 · PRISM Group, Oregon State University, https://prism.oregonstate.edu
FAQ
New York maple questions
- Which county in New York makes the most maple syrup?
- Clinton County, with 365,777 taps and 79,219 gallons of syrup across 64 farms in the 2022 Census of Agriculture, about 13% of the state's taps. USDA withheld totals for 5 counties to protect individual farms, so the ranking covers published counties.
- How many maple producers are there in New York?
- The 2022 Census of Agriculture counted 1,479 farms producing maple syrup in New York (1,675 in 2017), with 2,903,758 taps and 760,198 gallons of syrup. The Census counts farms, so backyard sugarmakers who don't sell are not included.
- Where does the sap run first in New York?
- By our weather record, Westchester County (White Plains) typically starts around February 2, while Hamilton County (Lake Pleasant) starts around March 17, a spread of about 43 days across the state.
Other states
The county atlas elsewhere

LuckySap · free on iPhone & Android
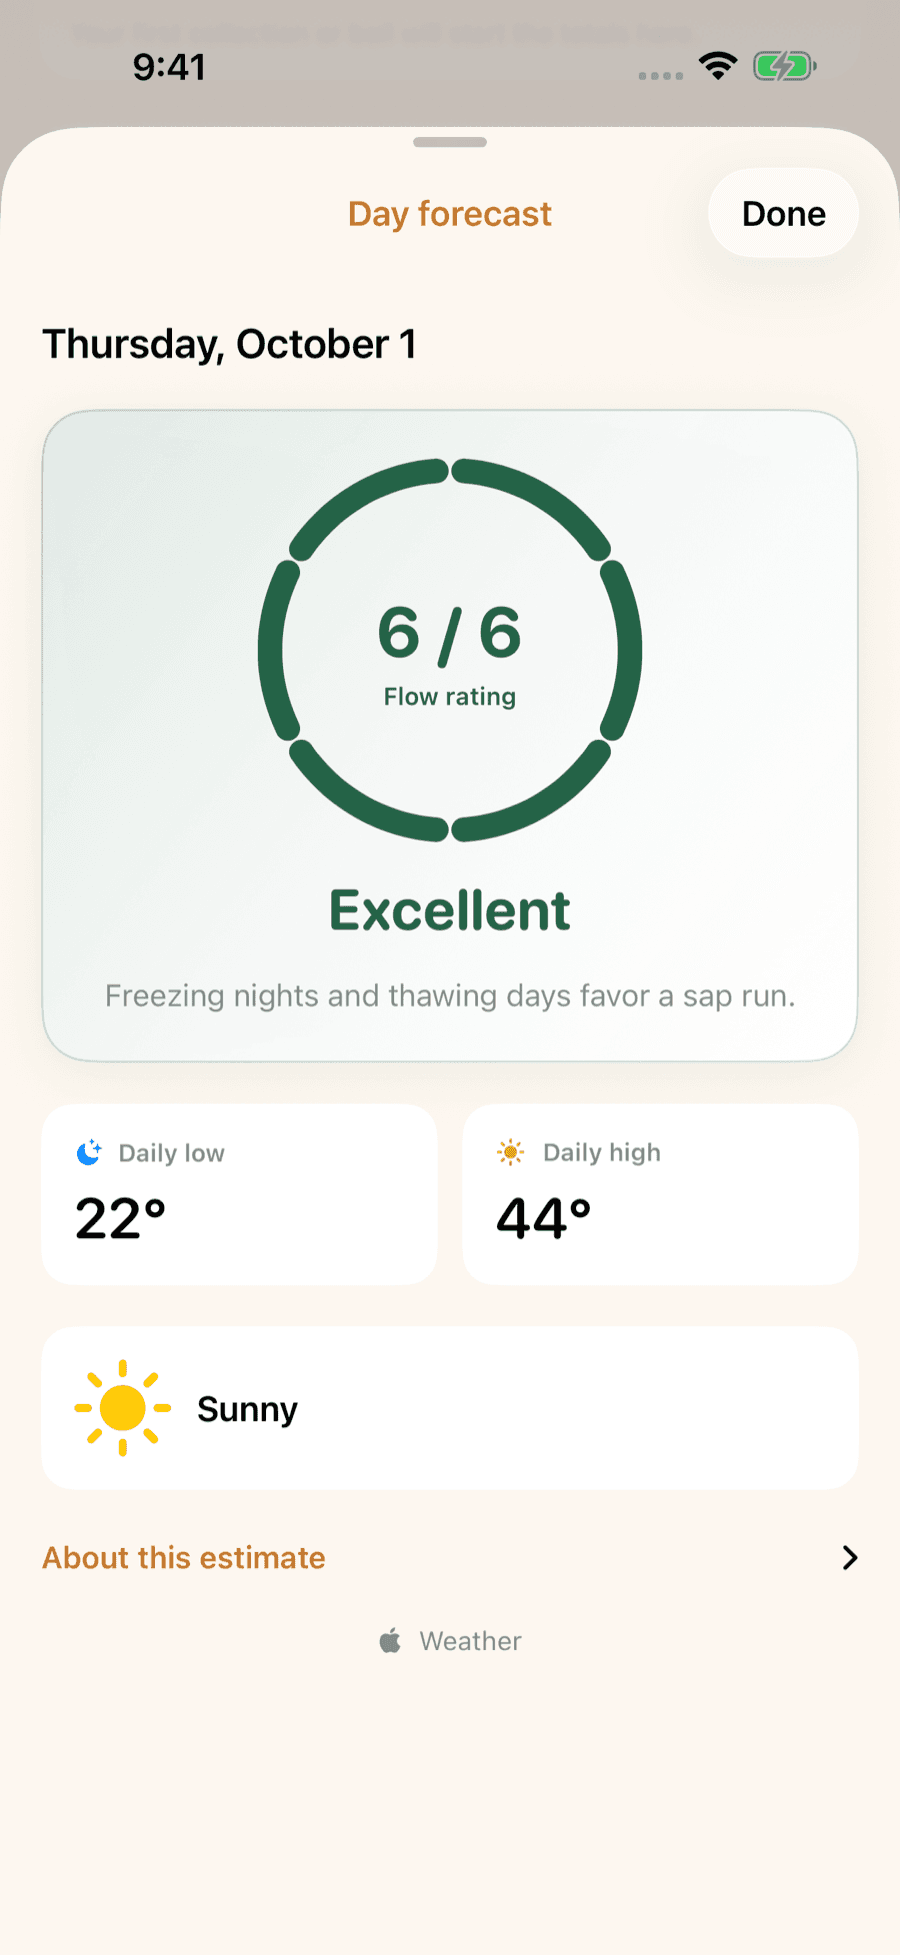
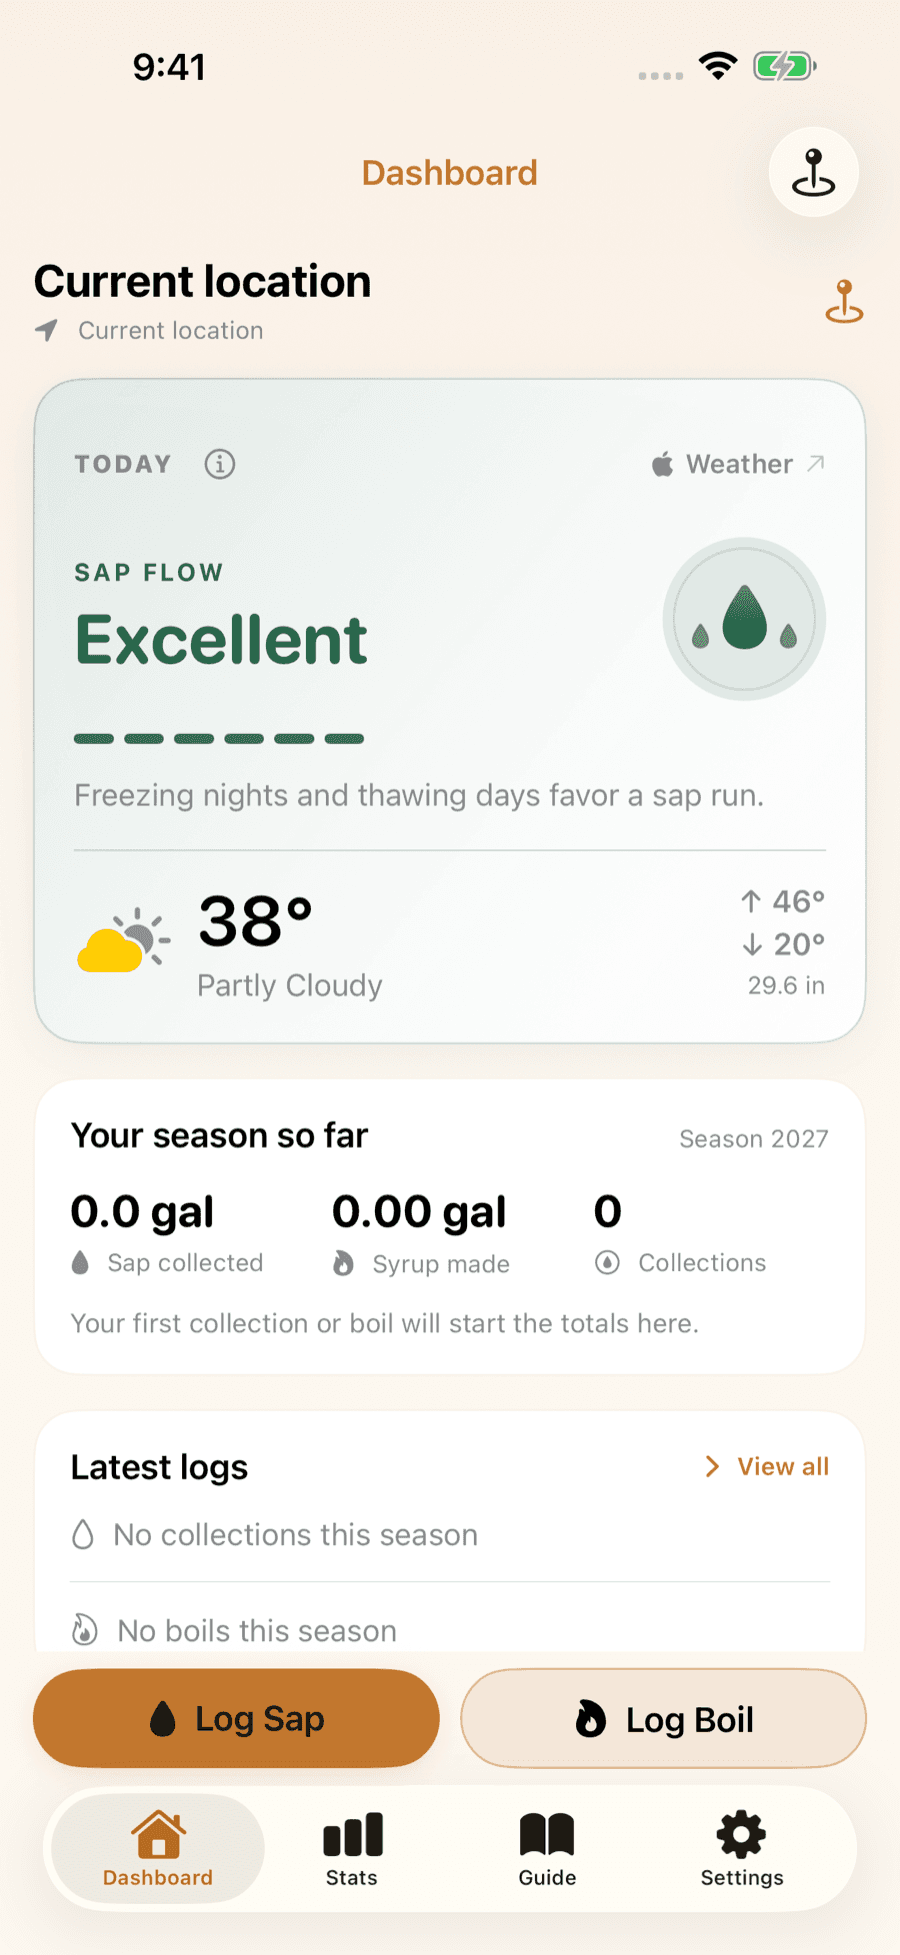
Know when New York's sap will run
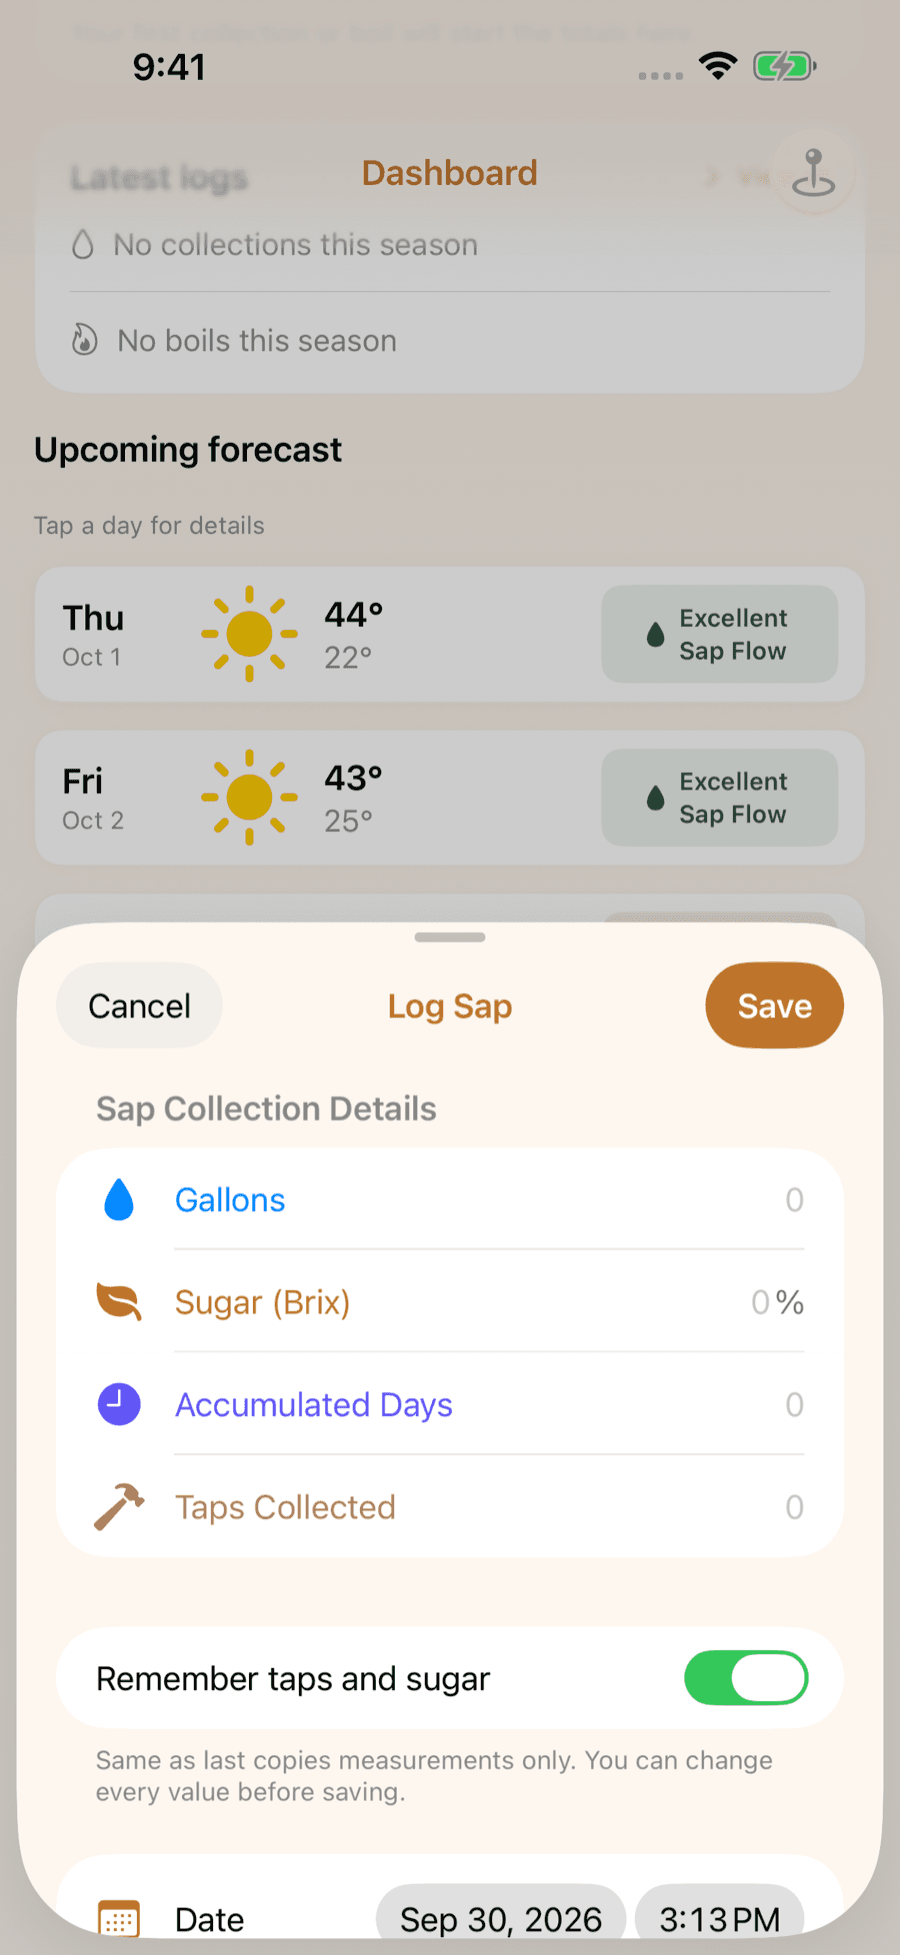
LuckySap checks the forecast for your trees and can ping you the night before a strong sap day, then keeps every collection and boil in one season log. Free on iPhone and Android.