Maple sugaring in L'Île-d'Orléans, Quebec
What stands out here
L'Île-d'Orléans’ leanest sap year was 2003, with 15 freeze-thaw days, while much of Quebec bottomed out in 2015. Its operations are small: about 2,277 taps per farm in 2021, against an average of 5,806 across the province’s atlas divisions.
- Sap starts
- Mar 21
- producers' record
- Season ends
- Apr 24
- about 5 weeks
- Sap days / season
- 24.6
- 1991–2025 average
- Taps, 2021
- 111,550
- #48 of 61 in QC
- Syrup, PPAQ 2026
- ≈38,000gal
- PPAQ 2026: 423,923 lb · 11.1 lb = 1 US gal
- Syrup per tap
- ≈0.34gal
- PPAQ 2026: 3.8 lb · 11.1 lb = 1 US gal
- Farms, 2021
- 49
- #40 of 92 in QC
- Tappable maples
- –
- no official count
Maple production
L'Île-d'Orléans in the Census of Agriculture
In 2021 Statistics Canada counted 49 farms reporting maple taps in L'Île-d'Orléans, with 111,550 taps; in 2016, 54 farms and 139,829 taps. Among Quebec's 61 census divisions with a published tap count, L'Île-d'Orléans ranks 48th, and 59th of the 94 in this atlas.
Over the five years the farm count changed −9% and taps −20% (Statistics Canada cautions that the two censuses are not strictly comparable).
| Census year | Farms reporting taps | Taps |
|---|---|---|
| 2021 | 49 | 111,550E |
| 2016 | 54 | 139,829 |
- E Statistics Canada quality grade: use with caution.
Sap-flow outlook at Saint-Pierre-de-l'Île-d'Orléans right now
Full Quebec forecast →Forecast for Saint-Pierre-de-l'Île-d'Orléans, QC
Updated Nov 21, 3:45 PM EST
Off-season
L'Île-d'Orléans' season opens in about 119 days
Typical opening: March 21.
What to do now
- 1
Hold the drill
Fall sap is low in sugar, and a November hole on buckets is spent by January.
- 2
Find and mark your trees
Easiest while the leaves are on. Tapping starts at 12 inches across, about 38 inches around.
- 3
Gather your gear
A drill with a clean 5/16-inch bit, one spout per taphole, covered food-grade buckets.
Show this week’s forecast anywayHide the forecast
Only marginal days ahead
freeze thaw 0 °C
- SunNov 221° / 10°No refreeze forecast
- MonNov 233° / 10°No refreeze forecast
- TueNov 24-5° / 0°Little thaw forecast
- WedNov 25-8° / 0°Little thaw forecast
- ThuNov 26-8° / 1°Maybe a light run
- FriNov 27-5° / 1°Maybe a light run
Data: Environment and Climate Change Canada. Verdicts use freeze-thaw thresholds from maple field research; your woods may run a little differently.
When the sap runs
The sugaring calendar at Saint-Pierre-de-l'Île-d'Orléans
Year-to-year spread
- Opening signal
- Median Mar 28; the middle half of seasons fell between Mar 25 and Apr 1. Earliest Mar 10 (2010), latest Apr 8 (1998).
- Closing signal
- Median Apr 25; middle half between Apr 21 and Apr 30. Earliest Apr 5 (2021), latest May 8 (2020).
- Sap days by month
- Dec10%Jan4%Feb7%Mar32%Apr43%May4%
35 seasons of sap weather
L'Île-d'Orléans seasons, 1991–2025
A separate, newer source
PPAQ regional fact sheet, 2026
From PPAQ’s 2026 Québec – Rive-Nord sheet: enterprises under the joint marketing plan, counted where the sugarbush is, so they sit beside the census figures above and are never added to them.
- Enterprises
- 30
- under the joint marketing plan
- Taps
- 112,149
- as printed
- Annual production
- 423,923 lb
- estimate, pounds of syrup
- Value
- $1.4 million
- Canadian dollars
Taps by forest ownership
Private forest 100%Public forest 0%
- Figures in millions are rounded to a tenth, as PPAQ printed them.
- Annual production is PPAQ's estimate (Groupe AGÉCO's yield estimate applied to the taps), not a measured harvest. Québec – Rive-Nord sheet (PDF, French)
Nearby
L'Île-d'Orléans and its neighbors
The biggest contrast nearby is scale: Bellechasse, 21 km away, had about 19 times as many taps in 2021.
This division
L'Île-d'Orléans
Saint-Pierre-de-l'Île-d'Orléans, QC
- Opens
- Mar 21
- Sap days
- 24.6
- Taps
- 111,550
5 km · Boischatel
La Côte-de-Beaupré
- Opens
- Mar 22
- 1 day later
- Sap days
- 25.1
- about the same
- Taps 2016
- 51,506
- –
12 km · Lévis
Lévis
- Opens
- Mar 21
- same day
- Sap days
- 24.5
- about the same
- Taps 2016
- 42,135
- –
13 km · Québec
Québec
- Opens
- Mar 19
- 2 days earlier
- Sap days
- 24
- about the same
- Taps 2016
- 70,802
- –
16 km · Sainte-Brigitte-de-Laval
La Jacques-Cartier
- Opens
- Mar 26
- 5 days later
- Sap days
- 27.1
- 3 more
- Taps 2016
- 12,185
- –
21 km · Saint-Henri
Bellechasse
- Opens
- Mar 20
- 1 day earlier
- Sap days
- 26.2
- 2 more
- Taps
- 2.2 million
- 19× as many


About these numbers
Season dates come from 35 seasons of Daymet temperatures at Saint-Pierre-de-l'Île-d'Orléans (a 1-km cell at 82 m (269 ft)), scored with our freeze-thaw rule; in Quebec they are anchored to producers’ reported seasons (Houle et al. 2015). Production figures are Statistics Canada’s as published, with PPAQ’s 2026 figures kept separate. How the atlas works → Put this sap forecast on your website →
Sources · 9
- 1.Maple taps, Census of Agriculture, 2021 (Table 32-10-0362-01) · Statistics Canada
- 2.Maple taps, Census of Agriculture, 2011 and 2016 (Table 32-10-0423-01) · Statistics Canada
- 3.Fiche région 2026 : Québec – Rive-Nord · Producteurs et productrices acéricoles du Québec
- 4.Daymet: Daily Surface Weather Data on a 1-km Grid for North America, Version 4 R1 · ORNL DAAC
- 5.Impacts of climate change on the timing of the production season of maple syrup in eastern Canada (PLOS ONE 10(12): e0144844, 2015) · Houle et al.
- 6.Sap flow in sugar maple: timing and weather drivers (Frontiers in Agronomy, 2025) · de Lima Santos et al.
Show 3 moreShow fewer
- 7.2021 Census cartographic boundary files (census divisions, population centres) · Statistics Canada
- 8.Population and dwelling counts, 2021 Census (Tables 98-10-0002-01 and 98-10-0011-01) · Statistics Canada
- 9.GeoNames geographical database (CA) · GeoNames
Licences and attribution
- Adapted from Statistics Canada, Census of Agriculture 2021, 2016 and 2011 (Tables 32-10-0362-01 and 32-10-0423-01), 2021 Census population and dwelling counts (Tables 98-10-0002-01 and 98-10-0011-01) and 2021 Census cartographic boundary files. This does not constitute an endorsement by Statistics Canada of this product.
- Contains information licensed under the Open Government Licence – Canada.
- Thornton, M.M., R. Shrestha, Y. Wei, P.E. Thornton, S-C. Kao, and B.E. Wilson. 2022. Daymet: Daily Surface Weather Data on a 1-km Grid for North America, Version 4 R1. ORNL DAAC, Oak Ridge, Tennessee, USA. https://doi.org/10.3334/ORNLDAAC/2129
- Place coordinates: GeoNames (geonames.org), CC BY 4.0.
- Québec MRC figures: Producteurs et productrices acéricoles du Québec, Fiches région 2026 (production estimates from Groupe AGÉCO).
FAQ
L'Île-d'Orléans sugaring questions
- When should I tap maple trees in L'Île-d'Orléans, Quebec?
- In a typical year the sap starts running around March 21 near Saint-Pierre-de-l'Île-d'Orléans and the season winds down around April 24. In the past 35 seasons the weather signal came as early as Mar 10 and as late as Apr 8.
- How much maple syrup does L'Île-d'Orléans produce?
- Statistics Canada doesn't publish syrup volume by census division. Its 2021 Census of Agriculture counted 49 farms reporting 111,550 maple taps in L'Île-d'Orléans, number 48 of 61 Quebec divisions with a published count. Separately, the PPAQ's 2026 fact sheet for the Québec – Rive-Nord region estimates annual production at 423,923 lb of syrup from 112,149 taps.
- How many sap days does L'Île-d'Orléans get in a season?
- On average 24.6 freeze-thaw sap days from December through May at Saint-Pierre-de-l'Île-d'Orléans, of which about 10.7 are textbook days with a night between about −7 and −2 °C and a day between 4 and 9 °C. The best season since 1991 was 2020 (41 sap days); the leanest was 2003 (15).

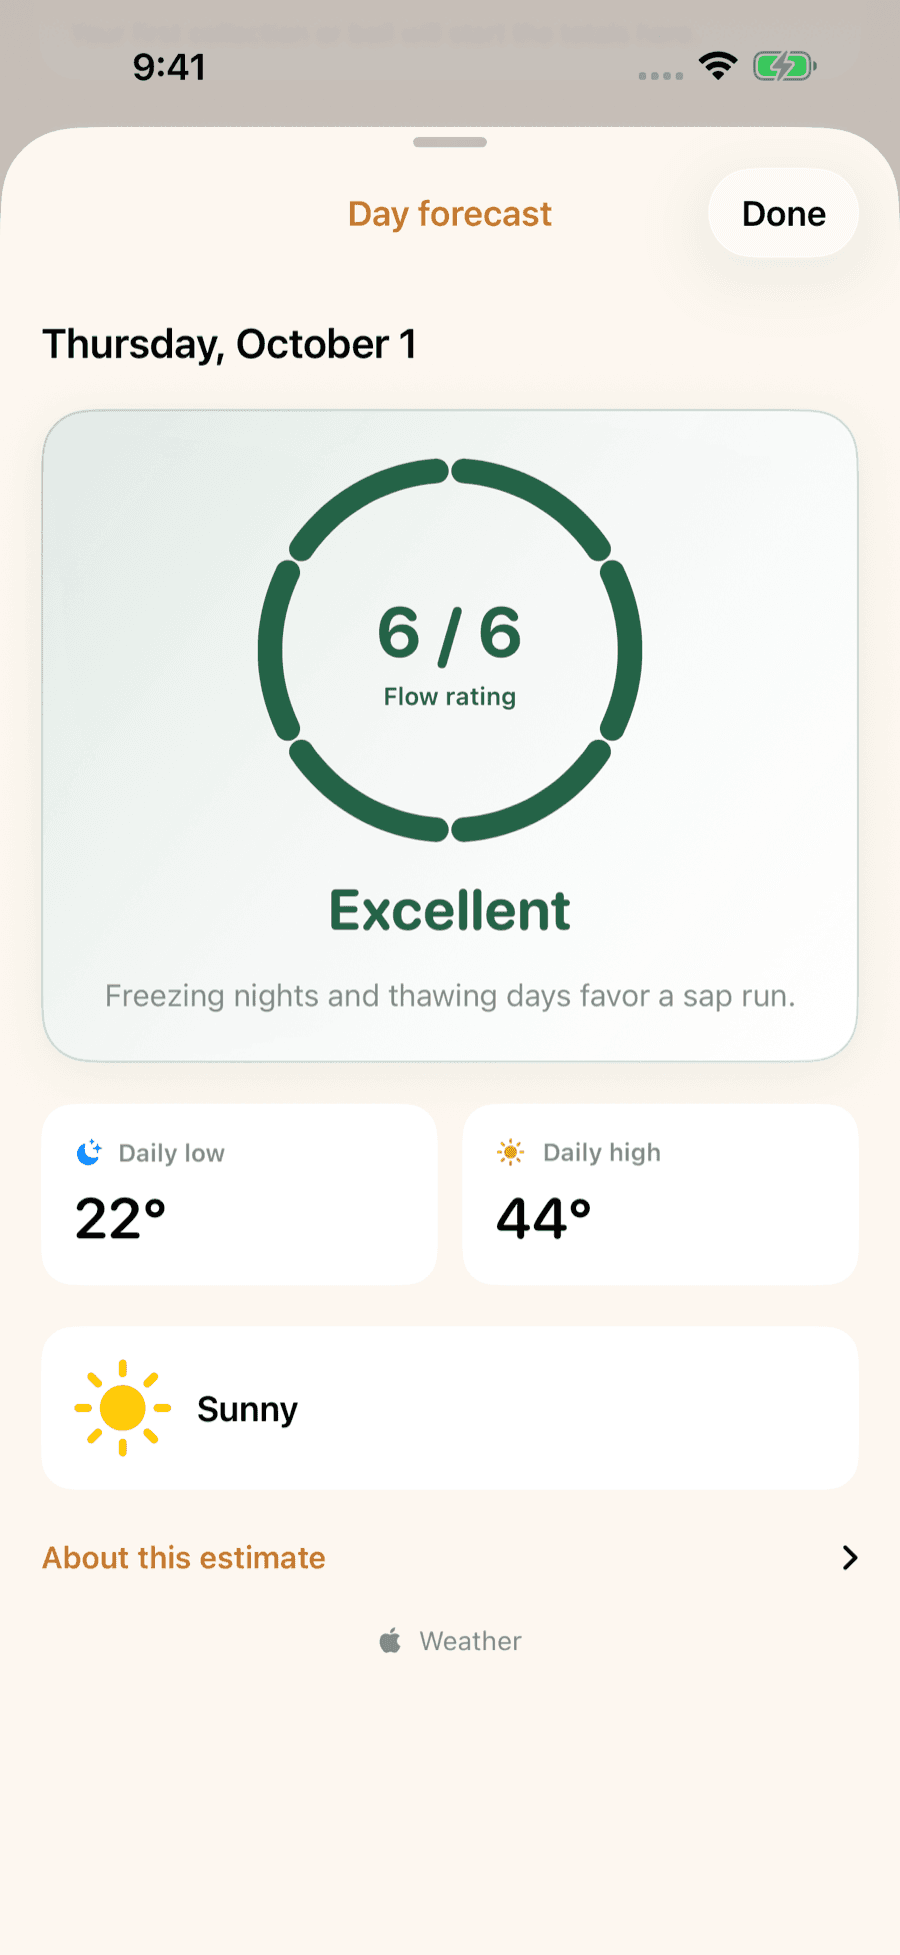
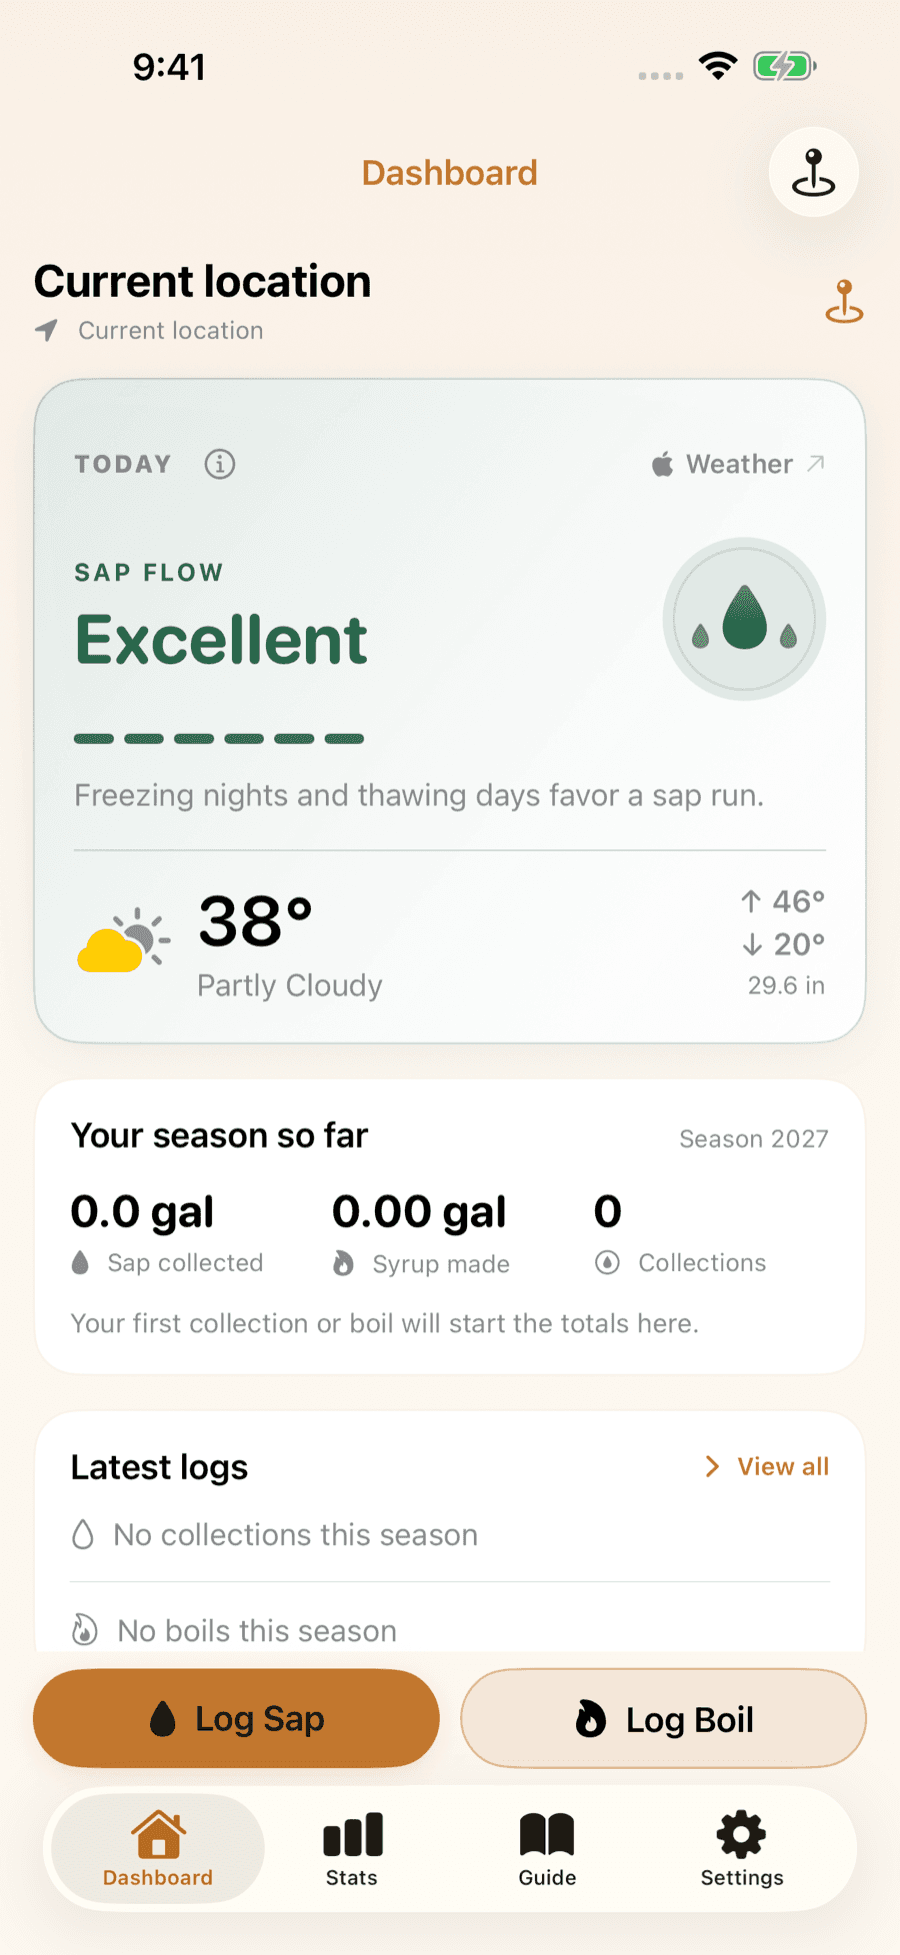
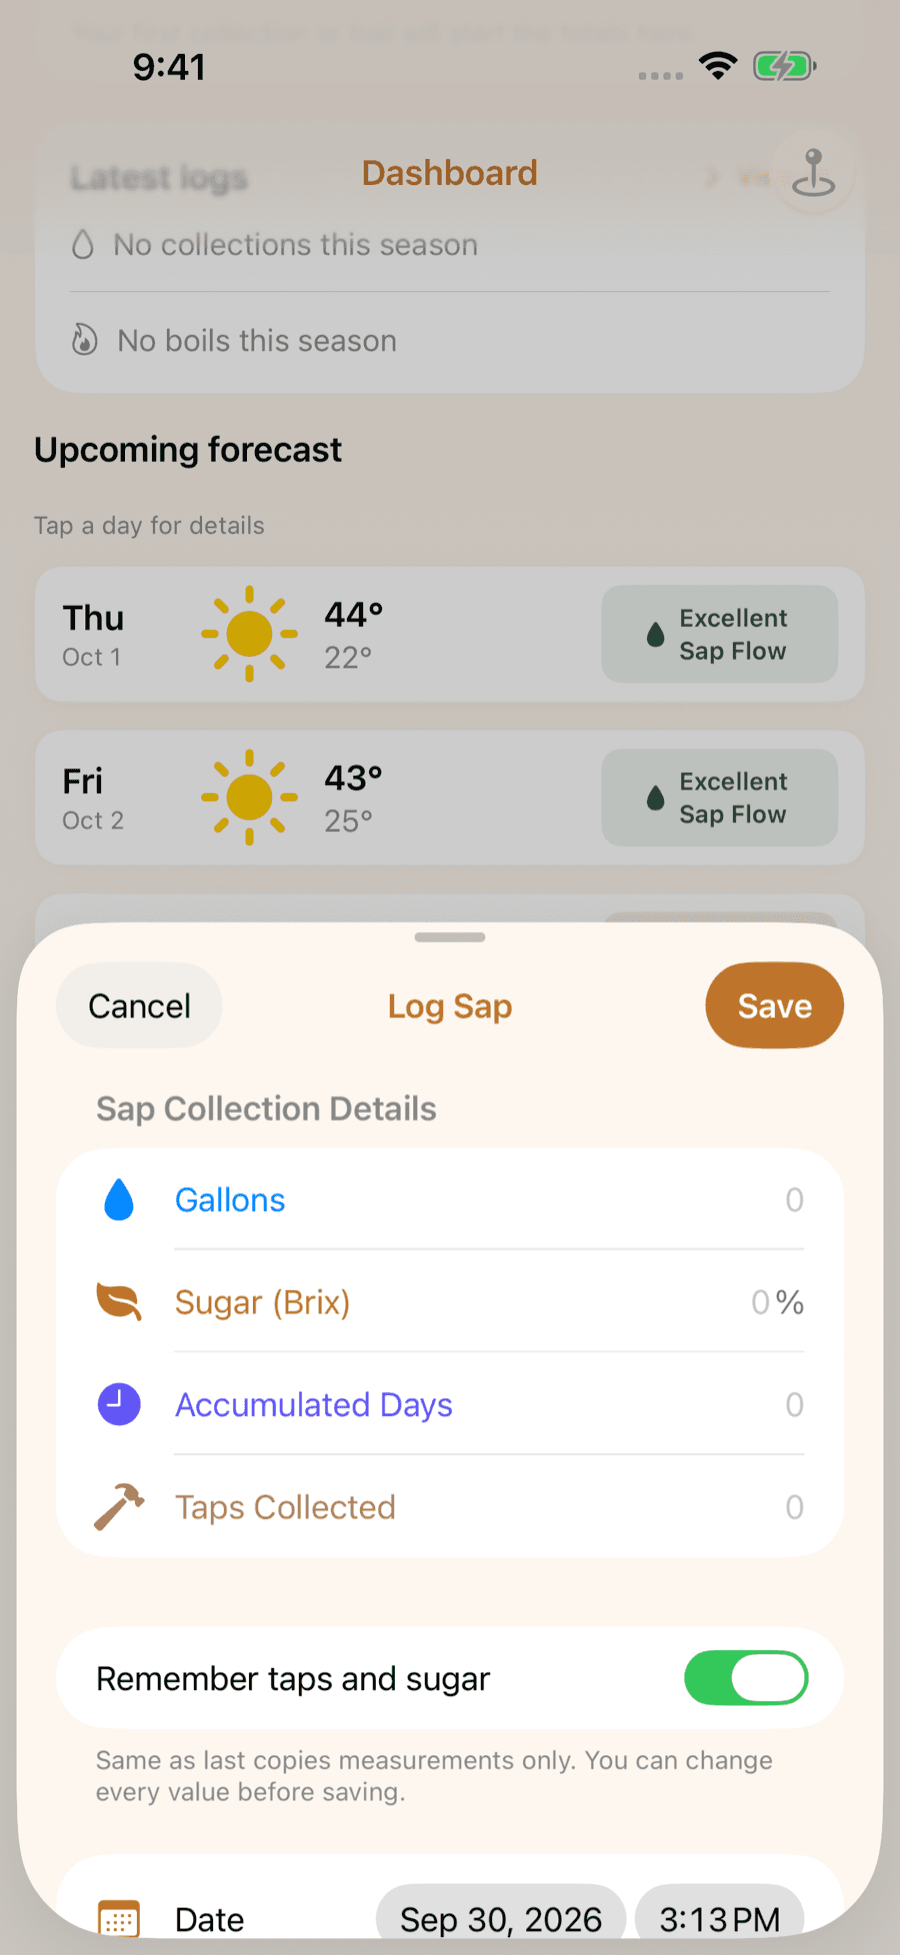
LuckySap · free on iPhone & Android
Know when the sap will run in L'Île-d'Orléans
LuckySap turns the forecast for your trees into a day-by-day sap-flow outlook, can ping you the evening before a strong sap day, and keeps every collection and boil in one season log. Free on iPhone and Android.