Maple sugaring in Montmagny, Quebec
What stands out here
Montmagny’s leanest sap year was 1998, with 15 freeze-thaw days, while much of Quebec bottomed out in 2015. PPAQ’s 2026 regional fact sheet counts about 1.6 million taps here, more than most MRCs.
- Sap starts
- Mar 20
- producers' record
- Season ends
- Apr 23
- about 5 weeks
- Sap days / season
- 24.8
- 1991–2025 average
- Taps, 2021
- 1.1 million
- #13 of 61 in QC
- Syrup, PPAQ 2026
- ≈530,000gal
- PPAQ 2026: 5.9 million lb · 11.1 lb = 1 US gal
- Syrup per tap
- ≈0.33gal
- PPAQ 2026: about 3.7 lb · 11.1 lb = 1 US gal
- Farms, 2021
- 147
- #17 of 92 in QC
- Tappable maples
- –
- no official count
Maple production
Montmagny in the Census of Agriculture
In 2021 Statistics Canada counted 147 farms reporting maple taps in Montmagny, with 1,147,794 taps; in 2016, 140 farms and 1,185,483 taps. Among Quebec's 61 census divisions with a published tap count, Montmagny ranks 13th, and 14th of the 94 in this atlas.
Over the five years the farm count changed +5% and taps −3% (Statistics Canada cautions that the two censuses are not strictly comparable).
| Census year | Farms reporting taps | Taps |
|---|---|---|
| 2021 | 147 | 1,147,794 |
| 2016 | 140 | 1,185,483 |
Sap-flow outlook at Montmagny right now
Full Quebec forecast →Forecast for Montmagny, QC
Updated Nov 22, 5:00 AM EST
Off-season
Montmagny's season opens in about 118 days
Typical opening: March 20.
What to do now
- 1
Hold the drill
Fall sap is low in sugar, and a November hole on buckets is spent by January.
- 2
Find and mark your trees
Easiest while the leaves are on. Tapping starts at 12 inches across, about 38 inches around.
- 3
Gather your gear
A drill with a clean 5/16-inch bit, one spout per taphole, covered food-grade buckets.
Show this week’s forecast anywayHide the forecast
Only marginal days ahead
freeze thaw 0 °C
- MonNov 238° / 9°No refreeze forecast
- TueNov 24-2° / 0°Little thaw forecast
- WedNov 25-6° / -2°Little thaw forecast
- ThuNov 26-3° / 3°Maybe a light run
- FriNov 27-4° / 1°Maybe a light run
- SatNov 28-3° / 1°Maybe a light run
Data: Environment and Climate Change Canada. Verdicts use freeze-thaw thresholds from maple field research; your woods may run a little differently.
When the sap runs
The sugaring calendar at Montmagny
Year-to-year spread
- Opening signal
- Median Mar 27; the middle half of seasons fell between Mar 22 and Mar 29. Earliest Mar 9 (2010), latest Apr 8 (1998).
- Closing signal
- Median Apr 24; middle half between Apr 19 and Apr 29. Earliest Apr 5 (2021), latest May 6 (1992).
- Sap days by month
- Dec11%Jan5%Feb9%Mar32%Apr39%May3%
35 seasons of sap weather
Montmagny seasons, 1991–2025
A separate, newer source
PPAQ regional fact sheet, 2026
From PPAQ’s 2026 Côte-du-Sud sheet: enterprises under the joint marketing plan, counted where the sugarbush is, so they sit beside the census figures above and are never added to them.
- Enterprises
- 166
- under the joint marketing plan
- Taps
- 1.6 million
- rounded, as printed
- Annual production
- 5.9 million lb
- estimate, pounds of syrup
- Value
- $20.0 million
- Canadian dollars
Taps by forest ownership
Private forest 90%Public forest 10%
- Figures in millions are rounded to a tenth, as PPAQ printed them.
- Annual production is PPAQ's estimate (Groupe AGÉCO's yield estimate applied to the taps), not a measured harvest. Côte-du-Sud sheet (PDF, French)
Nearby
Montmagny and its neighbors
The biggest contrast nearby is scale: this division had about 10 times as many taps as L'Île-d'Orléans, 41 km away, in 2021.
This division
Montmagny
Montmagny, QC
- Opens
- Mar 20
- Sap days
- 24.8
- Taps
- 1.1 million
21 km · L'Islet
L'Islet
- Opens
- Mar 21
- 1 day later
- Sap days
- 25.3
- about the same
- Taps
- 2.8 million
- 2.5× as many
41 km · Saint-Pierre-de-l'Île-d'Orléans
L'Île-d'Orléans
- Opens
- Mar 21
- 1 day later
- Sap days
- 24.6
- about the same
- Taps
- 111,550
- 10× fewer
46 km · Boischatel
La Côte-de-Beaupré
- Opens
- Mar 22
- 2 days later
- Sap days
- 25.1
- about the same
- Taps 2016
- 51,506
- –
49 km · Sainte-Brigitte-de-Laval
La Jacques-Cartier
- Opens
- Mar 26
- 6 days later
- Sap days
- 27.1
- 2 more
- Taps 2016
- 12,185
- –
51 km · Baie-Saint-Paul
Charlevoix
- Opens
- Mar 21
- 1 day later
- Sap days
- 23.7
- 1 fewer
- Taps 2011
- 26,050
- –


About these numbers
Season dates come from 35 seasons of Daymet temperatures at Montmagny (a 1-km cell at 9 m (30 ft)), scored with our freeze-thaw rule; in Quebec they are anchored to producers’ reported seasons (Houle et al. 2015). Production figures are Statistics Canada’s as published, with PPAQ’s 2026 figures kept separate. How the atlas works → Put this sap forecast on your website →
Sources · 9
- 1.Maple taps, Census of Agriculture, 2021 (Table 32-10-0362-01) · Statistics Canada
- 2.Maple taps, Census of Agriculture, 2011 and 2016 (Table 32-10-0423-01) · Statistics Canada
- 3.Fiche région 2026 : Côte-du-Sud · Producteurs et productrices acéricoles du Québec
- 4.Daymet: Daily Surface Weather Data on a 1-km Grid for North America, Version 4 R1 · ORNL DAAC
- 5.Impacts of climate change on the timing of the production season of maple syrup in eastern Canada (PLOS ONE 10(12): e0144844, 2015) · Houle et al.
- 6.Sap flow in sugar maple: timing and weather drivers (Frontiers in Agronomy, 2025) · de Lima Santos et al.
Show 3 moreShow fewer
- 7.2021 Census cartographic boundary files (census divisions, population centres) · Statistics Canada
- 8.Population and dwelling counts, 2021 Census (Tables 98-10-0002-01 and 98-10-0011-01) · Statistics Canada
- 9.GeoNames geographical database (CA) · GeoNames
Licences and attribution
- Adapted from Statistics Canada, Census of Agriculture 2021, 2016 and 2011 (Tables 32-10-0362-01 and 32-10-0423-01), 2021 Census population and dwelling counts (Tables 98-10-0002-01 and 98-10-0011-01) and 2021 Census cartographic boundary files. This does not constitute an endorsement by Statistics Canada of this product.
- Contains information licensed under the Open Government Licence – Canada.
- Thornton, M.M., R. Shrestha, Y. Wei, P.E. Thornton, S-C. Kao, and B.E. Wilson. 2022. Daymet: Daily Surface Weather Data on a 1-km Grid for North America, Version 4 R1. ORNL DAAC, Oak Ridge, Tennessee, USA. https://doi.org/10.3334/ORNLDAAC/2129
- Place coordinates: GeoNames (geonames.org), CC BY 4.0.
- Québec MRC figures: Producteurs et productrices acéricoles du Québec, Fiches région 2026 (production estimates from Groupe AGÉCO).
FAQ
Montmagny sugaring questions
- When should I tap maple trees in Montmagny, Quebec?
- In a typical year the sap starts running around March 20 near Montmagny and the season winds down around April 23. In the past 35 seasons the weather signal came as early as Mar 9 and as late as Apr 8.
- How much maple syrup does Montmagny produce?
- Statistics Canada doesn't publish syrup volume by census division. Its 2021 Census of Agriculture counted 147 farms reporting 1,147,794 maple taps in Montmagny, number 13 of 61 Quebec divisions with a published count. Separately, the PPAQ's 2026 fact sheet for the Côte-du-Sud region estimates annual production at 5.9 million lb of syrup from 1.6 million taps.
- How many sap days does Montmagny get in a season?
- On average 24.8 freeze-thaw sap days from December through May at Montmagny, of which about 11.3 are textbook days with a night between about −7 and −2 °C and a day between 4 and 9 °C. The best season since 1991 was 2020 (42 sap days); the leanest was 1998 (15).

LuckySap · free on iPhone & Android
Know when the sap will run in Montmagny
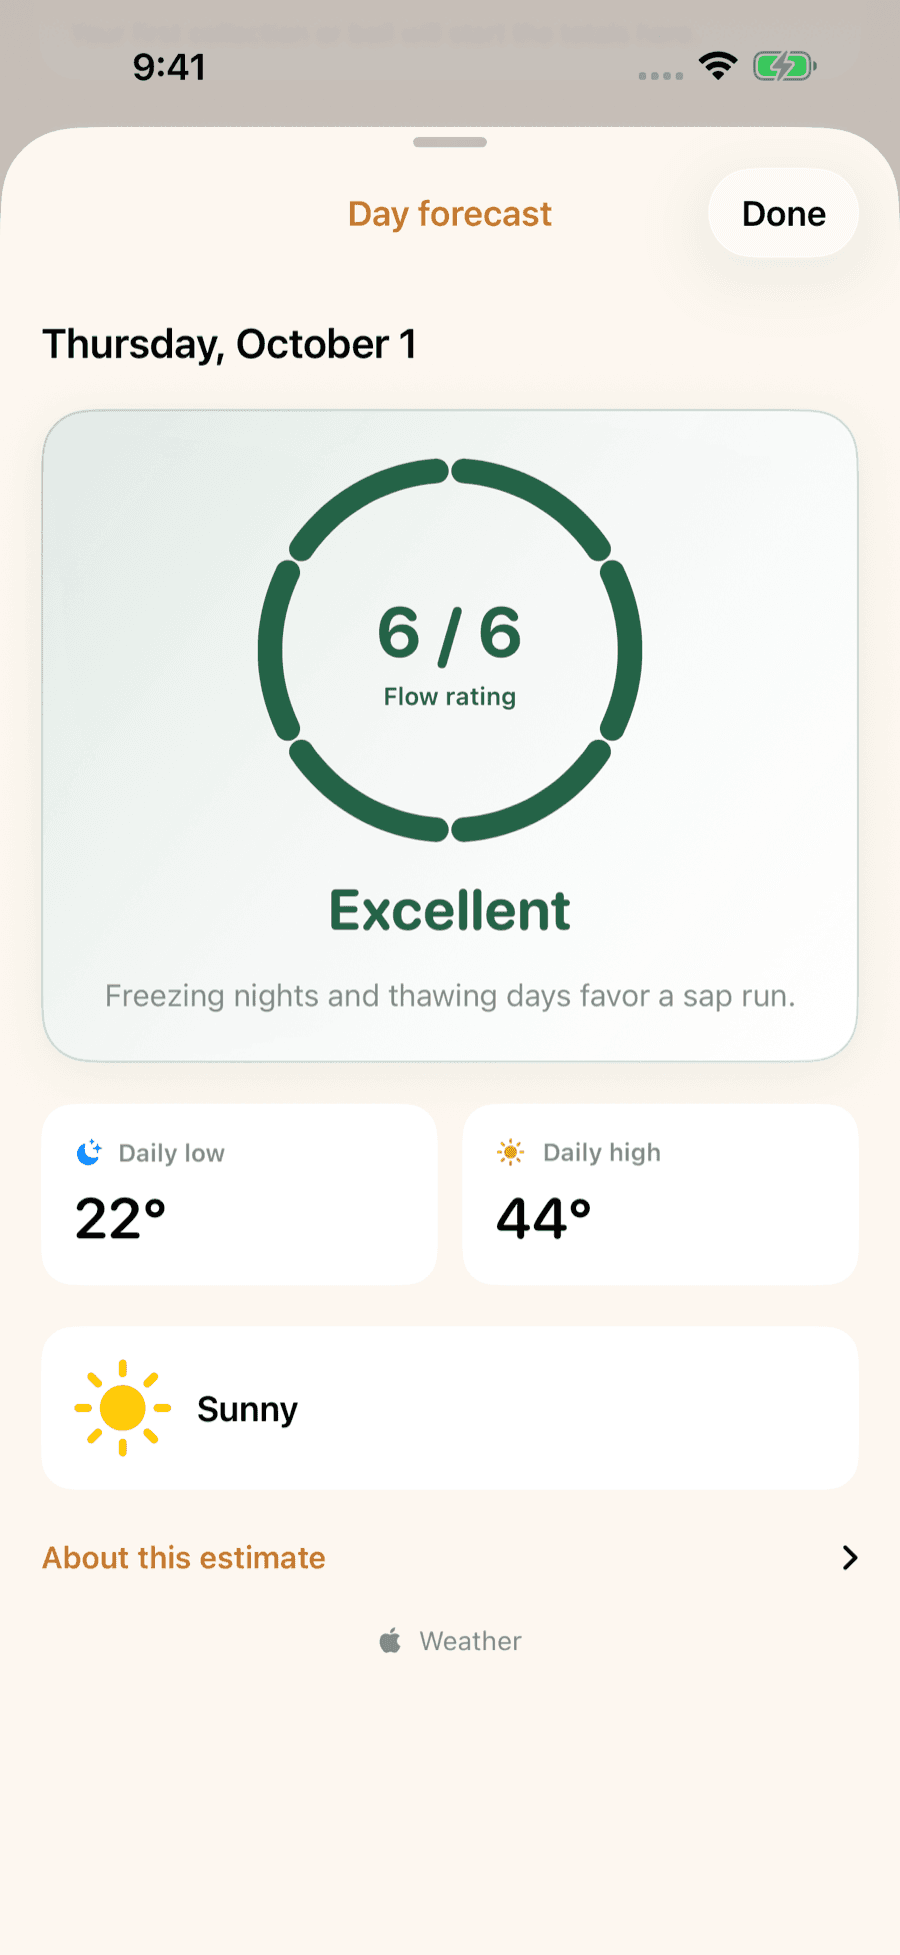
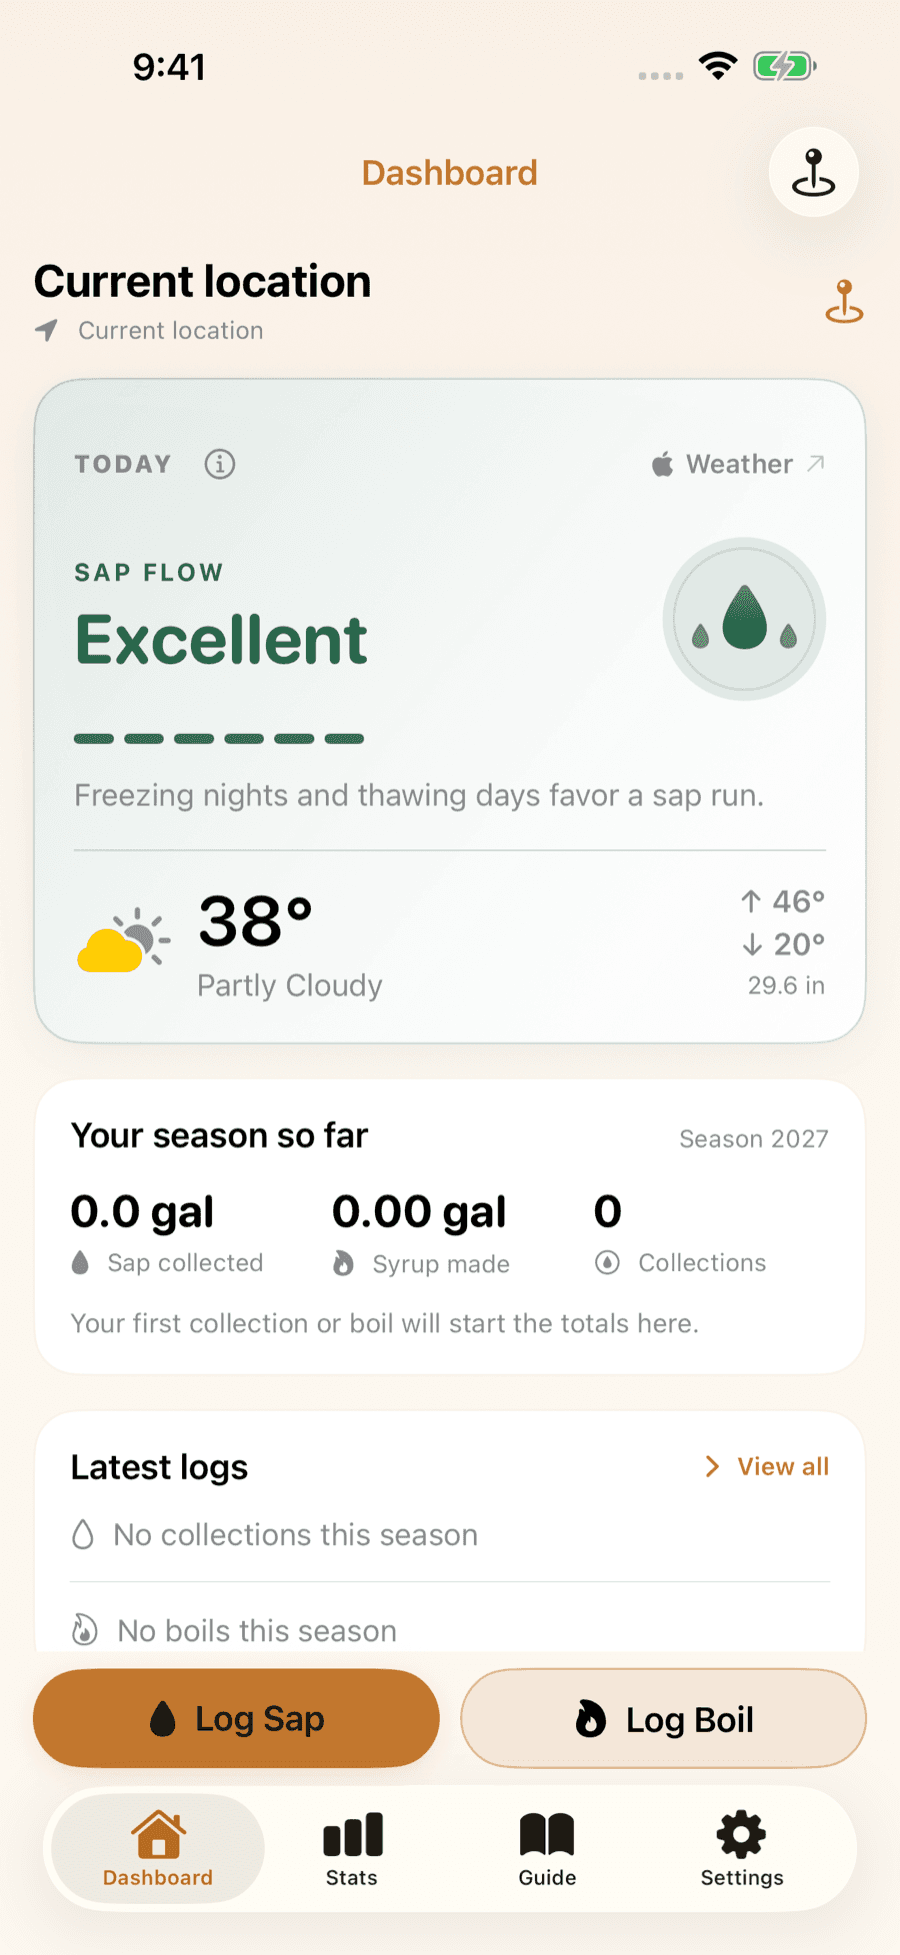
LuckySap turns the forecast for your trees into a day-by-day sap-flow outlook, can ping you the evening before a strong sap day, and keeps every collection and boil in one season log. Free on iPhone and Android.