Maple sugaring in Essex, Ontario
- Sap starts
- Feb 22
- weather estimate
- Season ends
- Mar 24
- about 4 weeks
- Sap days / season
- 31
- 1991–2025 average
- Taps, 2021
- withheld
- by Statistics Canada
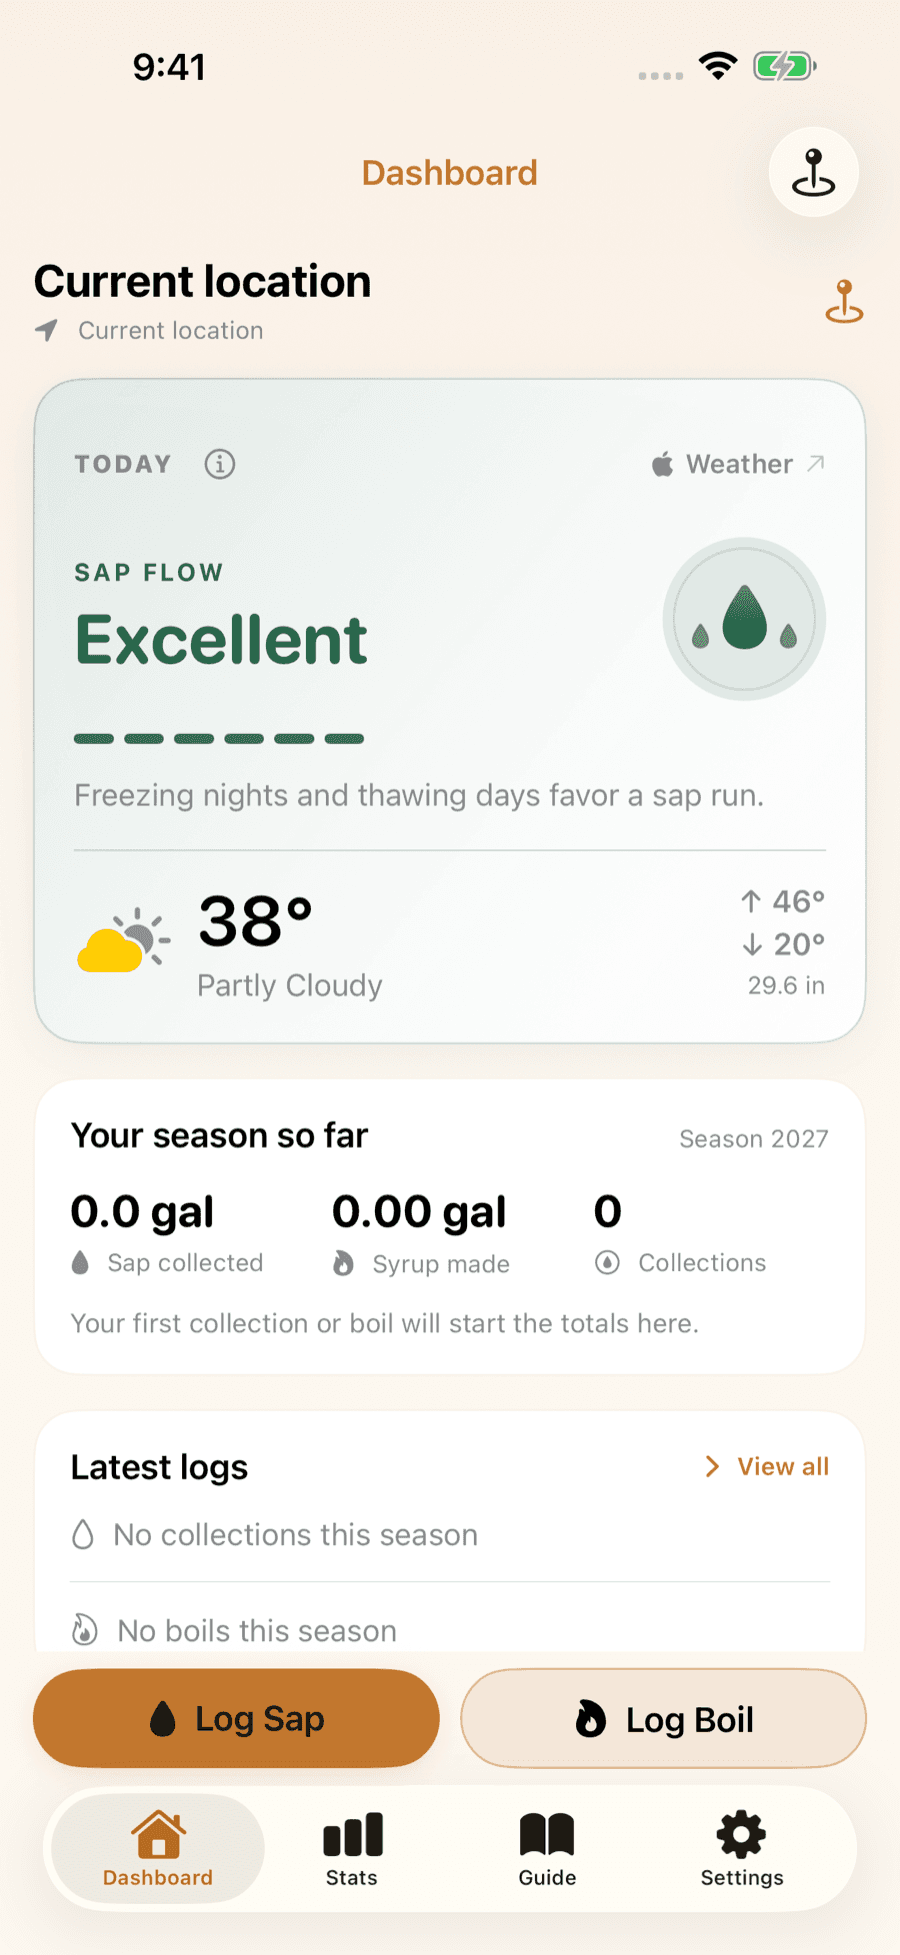
Sap-flow outlook at Windsor right now
Full Ontario forecast →Forecast for Windsor, ON
Updated Oct 7, 11:00 AM EDT
Off-season for now. Sap needs freezing nights, and none are in sight. Essex's season usually opens around February 22, which is 138 days away.
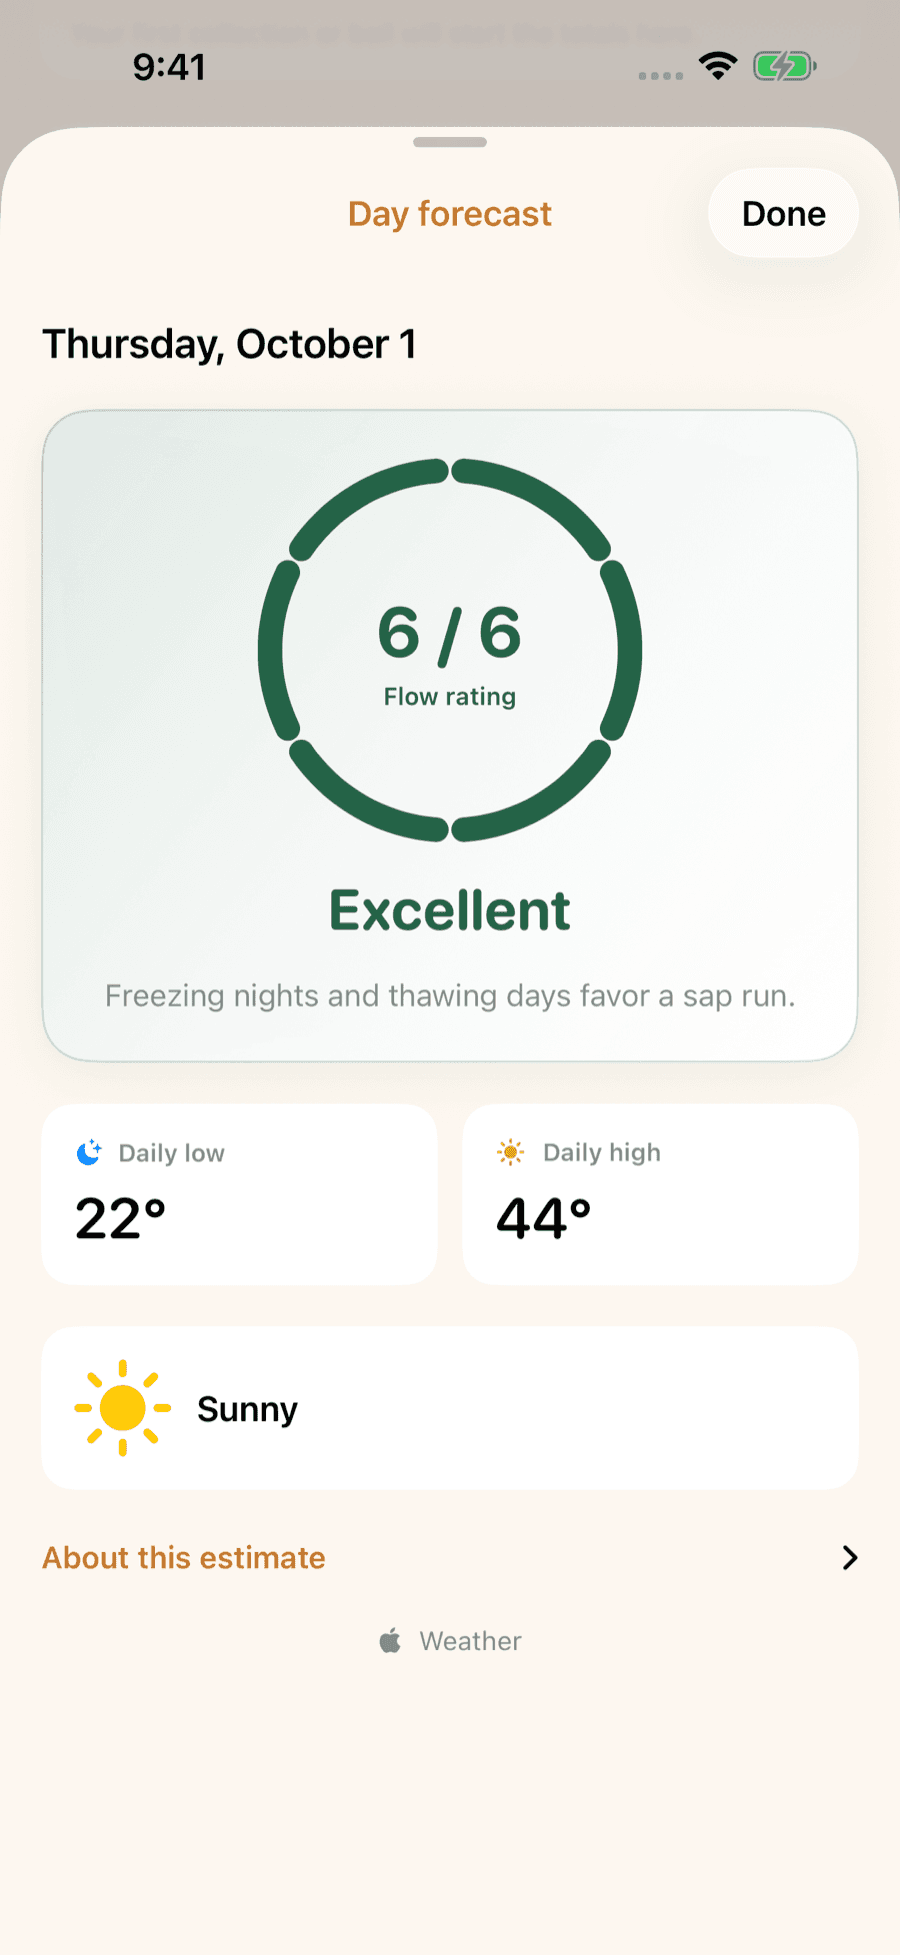
No freeze-thaw days in the forecast
freeze thaw 0 °C
- ThuOct 810° / 20°No refreeze forecast
- FriOct 97° / 21°No refreeze forecast
- SatOct 1011° / 28°No refreeze forecast
- SunOct 1115° / 24°No refreeze forecast
- MonOct 1214° / 23°No refreeze forecast
- TueOct 1314° / 19°No refreeze forecast
Data: Environment and Climate Change Canada. Verdicts use freeze-thaw thresholds from maple field research; your woods may run a little differently.
When the sap runs
The sugaring calendar at Windsor
Year-to-year spread
- Opening signal
- Median Feb 22; the middle half of seasons fell between Feb 10 and Feb 28. Earliest Jan 20 (2017), latest Mar 13 (2008).
- Closing signal
- Median Mar 24; middle half between Mar 15 and Mar 31. Earliest Feb 17 (2017), latest Apr 6 (2013).
- Sap days by month
- Dec18%Jan13%Feb21%Mar35%Apr12%May0%
35 seasons of sap weather
Essex seasons, 1991–2025
Maple production
Essex in the Census of Agriculture
Statistics Canada counts the farms that report maple taps in its Census of Agriculture every five years. In 2021 it counted 15 in Essex; in 2016, 16 farms and 555 taps.
Over the five years the farm count changed −6%. Statistics Canada cautions that 2021 and 2016 are not strictly comparable: the census-farm definition changed in 2021, and farms were assigned to their main location more strictly.
Statistics Canada doesn't publish syrup volume by census division, so the Canadian pages show farms and taps, not gallons or litres.
| Census year | Farms reporting taps | Taps |
|---|---|---|
| 2021 | 15 | withheld by Statistics Canada |
| 2016 | 16 | 555 |
- "Withheld by Statistics Canada": Statistics Canada suppressed the value as too unreliable to publish (F). The farm count is still published.
Nearby
Neighboring maple divisions
69 km · Chatham
Chatham-Kent
Sap ~Mar 2 – Mar 27 · 13,477 taps
91 km · Sarnia
Lambton
Sap ~Feb 28 – Mar 31 · 13,199 taps
159 km · St. Thomas
Elgin
Sap ~Mar 1 – Apr 2 · 16,486 taps
164 km · London
Middlesex
Sap ~Mar 5 – Apr 4 · 39,170 taps
167 km · South Huron
Huron
Sap ~Mar 7 – Apr 4 · 121,397 taps
206 km · Stratford
Perth
Sap ~Mar 11 – Apr 12 · 38,554 taps
About these numbers
The season dates are estimated from 35 seasons of daily high and low temperatures for the Daymet 1-km grid cell at Windsor, the division's most populous municipality in the 2021 Census; the cell sits at 190 m (623 ft). Each day is scored with the same freeze-thaw rule as our live forecast: a sap day is an overnight low under −1 °C (30.2 °F) followed by an afternoon high over +3 °C (37.4 °F). A season's closing signal is the last sap day before accumulated warmth reaches a threshold, and the opening signal sits 35 days before that, never earlier than the first real freeze-thaw week. The rule was calibrated on 117 state-seasons of USDA-reported dates in the US and is applied here unchanged. Ontario has no official season record, so the typical dates are a weather estimate. Production figures are copied from Statistics Canada as published. Full method, the Daymet checks and the Quebec validation → Run a sugarhouse here? Put this sap forecast on your own website →
Sources · 7
- 1.Maple taps, Census of Agriculture, 2021 (Table 32-10-0362-01) · Statistics Canada
- 2.Maple taps, Census of Agriculture, 2011 and 2016 (Table 32-10-0423-01) · Statistics Canada
- 3.Daymet: Daily Surface Weather Data on a 1-km Grid for North America, Version 4 R1 · ORNL DAAC
- 4.Sap flow in sugar maple: timing and weather drivers (Frontiers in Agronomy, 2025) · de Lima Santos et al.
- 5.2021 Census cartographic boundary files (census divisions, population centres) · Statistics Canada
- 6.Population and dwelling counts, 2021 Census (Tables 98-10-0002-01 and 98-10-0011-01) · Statistics Canada
Show 1 moreShow fewer
- 7.GeoNames geographical database (CA) · GeoNames
Licences and attribution
- Adapted from Statistics Canada, Census of Agriculture 2021 and 2016 (Tables 32-10-0362-01 and 32-10-0423-01), 2021 Census population and dwelling counts (Tables 98-10-0002-01 and 98-10-0011-01) and 2021 Census cartographic boundary files. This does not constitute an endorsement by Statistics Canada of this product.
- Contains information licensed under the Open Government Licence – Canada.
- Thornton, M.M., R. Shrestha, Y. Wei, P.E. Thornton, S-C. Kao, and B.E. Wilson. 2022. Daymet: Daily Surface Weather Data on a 1-km Grid for North America, Version 4 R1. ORNL DAAC, Oak Ridge, Tennessee, USA. https://doi.org/10.3334/ORNLDAAC/2129
- Place coordinates: GeoNames (geonames.org), CC BY 4.0.
FAQ
Essex sugaring questions
- When should I tap maple trees in Essex, Ontario?
- In a typical year the sap starts running around February 22 near Windsor and the season winds down around March 24. Have your taps in a day or two before the first forecast string of nights below −1 °C and days above +3 °C. In the past 35 seasons the weather signal came as early as Jan 20 and as late as Mar 13.
- How much maple syrup does Essex produce?
- Statistics Canada doesn't publish syrup volume by census division. Its 2021 Census of Agriculture counted 15 farms reporting maple taps in Essex; the tap count was withheld by Statistics Canada.
- How many sap days does Essex get in a season?
- On average 31 freeze-thaw sap days from December through May at Windsor, of which about 16.2 are textbook days with a night between about −7 and −2 °C and a day between 4 and 9 °C. The best season since 1991 was 2018 (44 sap days); the leanest was 2003 (21).
- Where do these dates come from?
- From 35 seasons of daily high and low temperatures at Windsor (Daymet 1-km grid), scored with the same freeze-thaw rule as our live forecast. Ontario has no official season record, so they are a weather estimate. They describe a typical year at one point in the division; your sugarbush, slope and elevation can shift them by days.

LuckySap · free on iPhone & Android
Know when the sap will run in Essex
LuckySap turns the forecast for your trees into a day-by-day sap-flow outlook, can ping you the evening before a strong sap day, and keeps every collection and boil in one season log. Free on iPhone and Android.