Maple sugaring in Isanti County, Minnesota
- Sap starts
- Mar 5
- typical year
- Season ends
- Apr 4
- about 4 weeks
- Sap days / season
- 35
- 1991–2026 average
- Taps, 2022
- 585
- #21 of 41 in MN
Sap-flow outlook at Cambridge right now
Full Minnesota forecast →Forecast for Cambridge, MN
Updated Oct 6, 6:44 AM EDT
Off-season for now. Sap needs freezing nights, and none are in sight. Isanti County's season usually opens around March 5, which is 150 days away.
No freeze-thaw days in the forecast
freeze thaw 32°F
- WedOct 748° / 69°
0h below · 24h above
No refreeze forecast - ThuOct 843° / 65°
0h below · 24h above
No refreeze forecast - FriOct 942° / 67°
0h below · 24h above
No refreeze forecast - SatOct 1053° / 77°
0h below · 24h above
No refreeze forecast - SunOct 1159° / 71°
0h below · 24h above
No refreeze forecast - MonOct 1250° / 57°No refreeze forecast
Data: National Weather Service. Verdicts use freeze-thaw thresholds from maple field research; your woods may run a little differently.
When the sap runs
The sugaring calendar at Cambridge
Year-to-year spread
- Opening signal
- Median Mar 15; the middle half of seasons fell between Mar 6 and Mar 21. Earliest Feb 15 (2012), latest Apr 2 (2013).
- Closing signal
- Median Apr 13; middle half between Apr 8 and Apr 21. Earliest Mar 11 (2012), latest May 4 (1996).
- Sap days by month
- Dec12%Jan6%Feb13%Mar37%Apr28%May3%
36 seasons of sap weather
Isanti County seasons, 1991–2026
Maple production
Isanti County in the Census of Agriculture
USDA counts maple operations every five years. In Isanti County the 2022 Census found 6 farms making syrup (-25% since 2017), with taps -67% and syrup output -47% over the same five years. That works out to about 0.20 gallons of syrup per tap in 2022 (0.13 in 2017). Among the 385 counties in this atlas, Isanti County ranks 307 by taps.
| Census year | Farms | Taps | Gallons of syrup | Gal / tap |
|---|---|---|---|---|
| 2022 | 6 | 585 | 118 | 0.20 |
| 2017 | 8 | 1,765 | 222 | 0.13 |
Nearby
Neighboring maple counties
21 mi · Mora, MN
Kanabec County
Sap ~Mar 5 – Apr 6 · 1,030 taps
21 mi · Pine City, MN
Pine County
Sap ~Mar 6 – Apr 6 · 2,525 taps
23 mi · Center City, MN
Chisago County
Sap ~Mar 2 – Apr 2 · 10,667 taps
24 mi · Milaca, MN
Mille Lacs County
Sap ~Mar 6 – Apr 5 · 1,863 taps
27 mi · Anoka, MN
Anoka County
Sap ~Mar 2 – Apr 1 · 556 taps
38 mi · Balsam Lake, WI
Polk County
Sap ~Mar 16 – Apr 10 · 54,930 taps
About these numbers
The season dates are estimated from 36 seasons of daily high and low temperatures for the PRISM 4-km grid cell at Cambridge (948ft), scored with the same freeze-thaw rule as our live forecast: a sap day is an overnight low under 30.2 °F followed by an afternoon high over 37.4 °F. Each season's closing signal is the last sap day before accumulated warmth reaches a threshold, and the opening signal sits five weeks before that, never earlier than the first real freeze-thaw week. Tested against 117 state-seasons of USDA-reported dates, the rule lands within 5.5 days of the reported close and 6.6 days of the reported opening on average, and the typical dates shown here are scaled to Minnesota's USDA record (3 years). Production figures are copied from the Census as published. Full method, calibration tables and the downloadable dataset →
Sources · 6
- 1.2022 Census of Agriculture, County Level Data — Minnesota, Table 37: Maple Syrup, 2022 and 2017 · USDA National Agricultural Statistics Service
- 2.PRISM daily temperature grids (AN81d, 4 km), accessed 2026-10-05 · PRISM Group, Oregon State University, https://prism.oregonstate.edu
- 3.Applied Climate Information System (ACIS) web services · NOAA Regional Climate Centers
- 4.USDA NASS maple syrup reports — approximate average season opened and closed dates, 2011–2022 · USDA National Agricultural Statistics Service (mirrored by the University of Vermont)
- 5.Sap flow in sugar maple: timing and weather drivers (Frontiers in Agronomy, 2025) · de Lima Santos et al.
- 6.GeoNames gazetteer (cities500), CC BY 4.0 · GeoNames
FAQ
Isanti County sugaring questions
- When should I tap maple trees in Isanti County, Minnesota?
- In a typical year the sap starts running around March 5 near Cambridge and the season winds down around April 4. Have your taps in a day or two before the first forecast string of freezing nights and 40 °F days. In the past 36 seasons the weather signal came as early as Feb 15 and as late as Apr 2.
- How much maple syrup does Isanti County produce?
- The 2022 Census of Agriculture counted 6 maple operations in Isanti County with 585 taps producing 118 gallons of syrup, ranking 21 of 41 Minnesota's counties with published tap counts.
- How many sap days does Isanti County get in a season?
- On average 35 freeze-thaw sap days from December through May at Cambridge, of which about 9.7 are textbook days with a night in the 20s and a day in the 40s. The best season since 1991 was 2024 (52 sap days); the leanest was 2001 (21).
- Where do these dates come from?
- From 36 seasons of daily high and low temperatures at Cambridge (PRISM 4-km grid), scored with the same freeze-thaw rule as our live forecast, then calibrated against USDA's reported season dates for Minnesota. They describe a typical year at one point in the county; your sugarbush, slope and elevation can shift them by days.

LuckySap · free on iPhone & Android
Get a heads-up when the sap will run in Isanti County
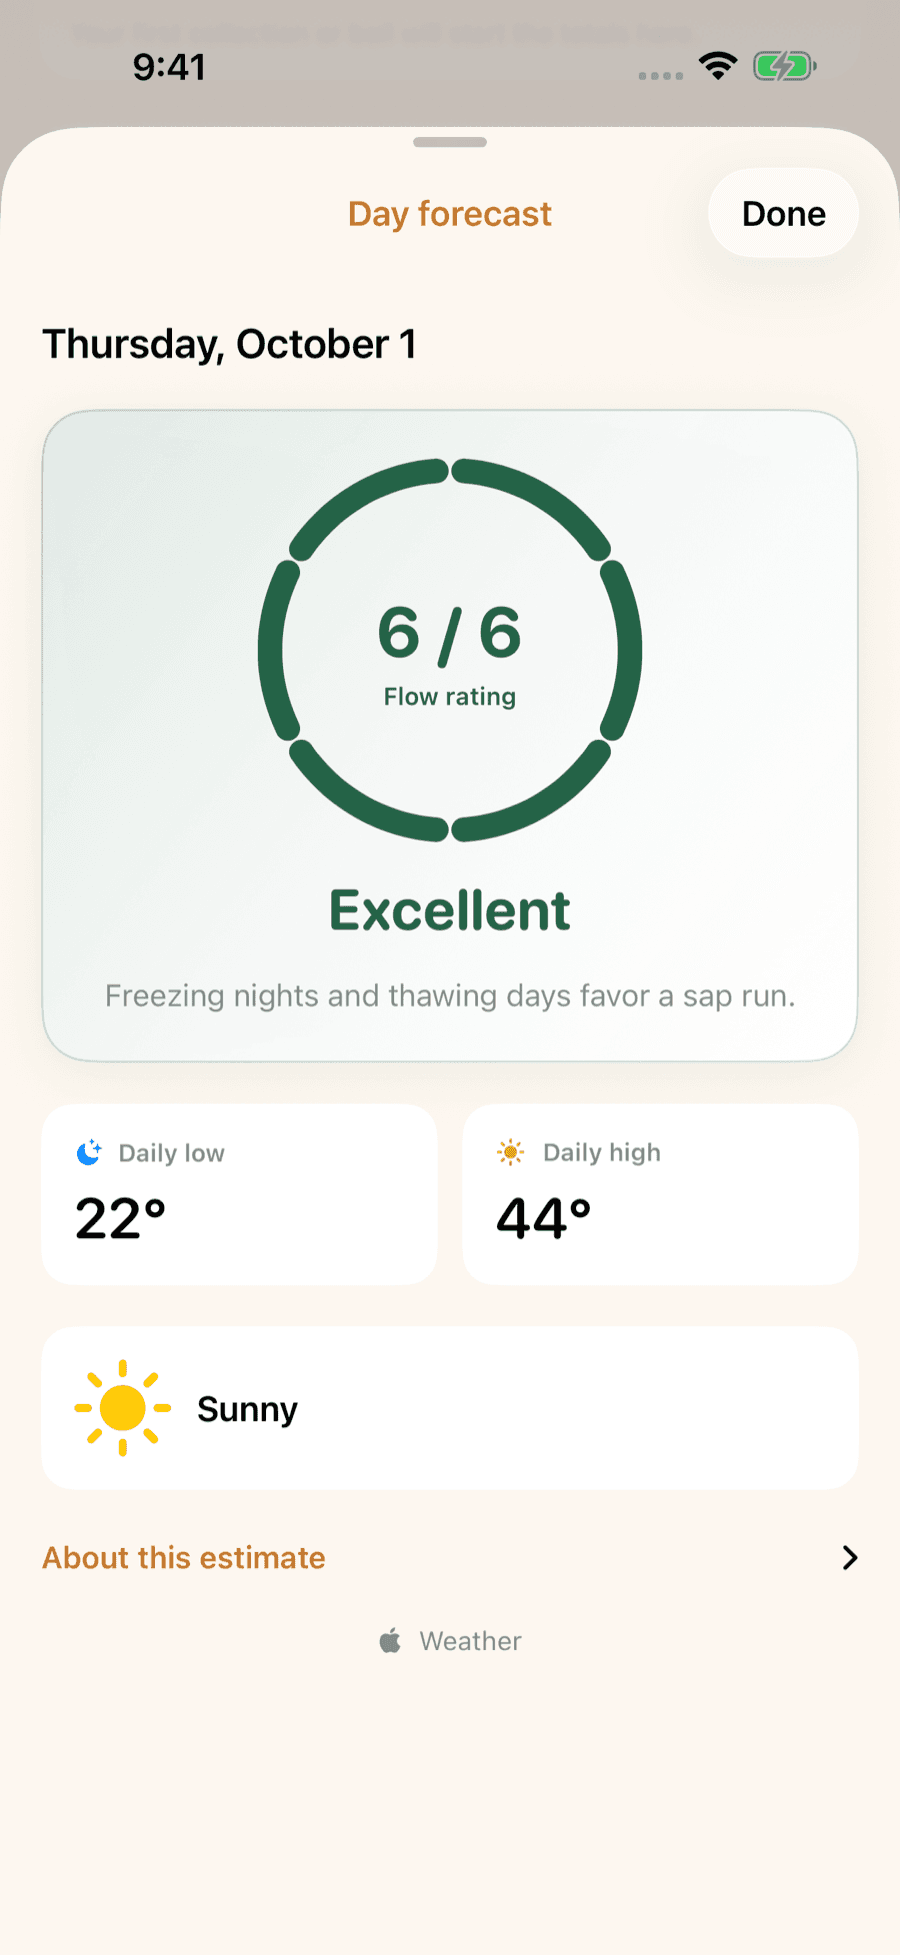
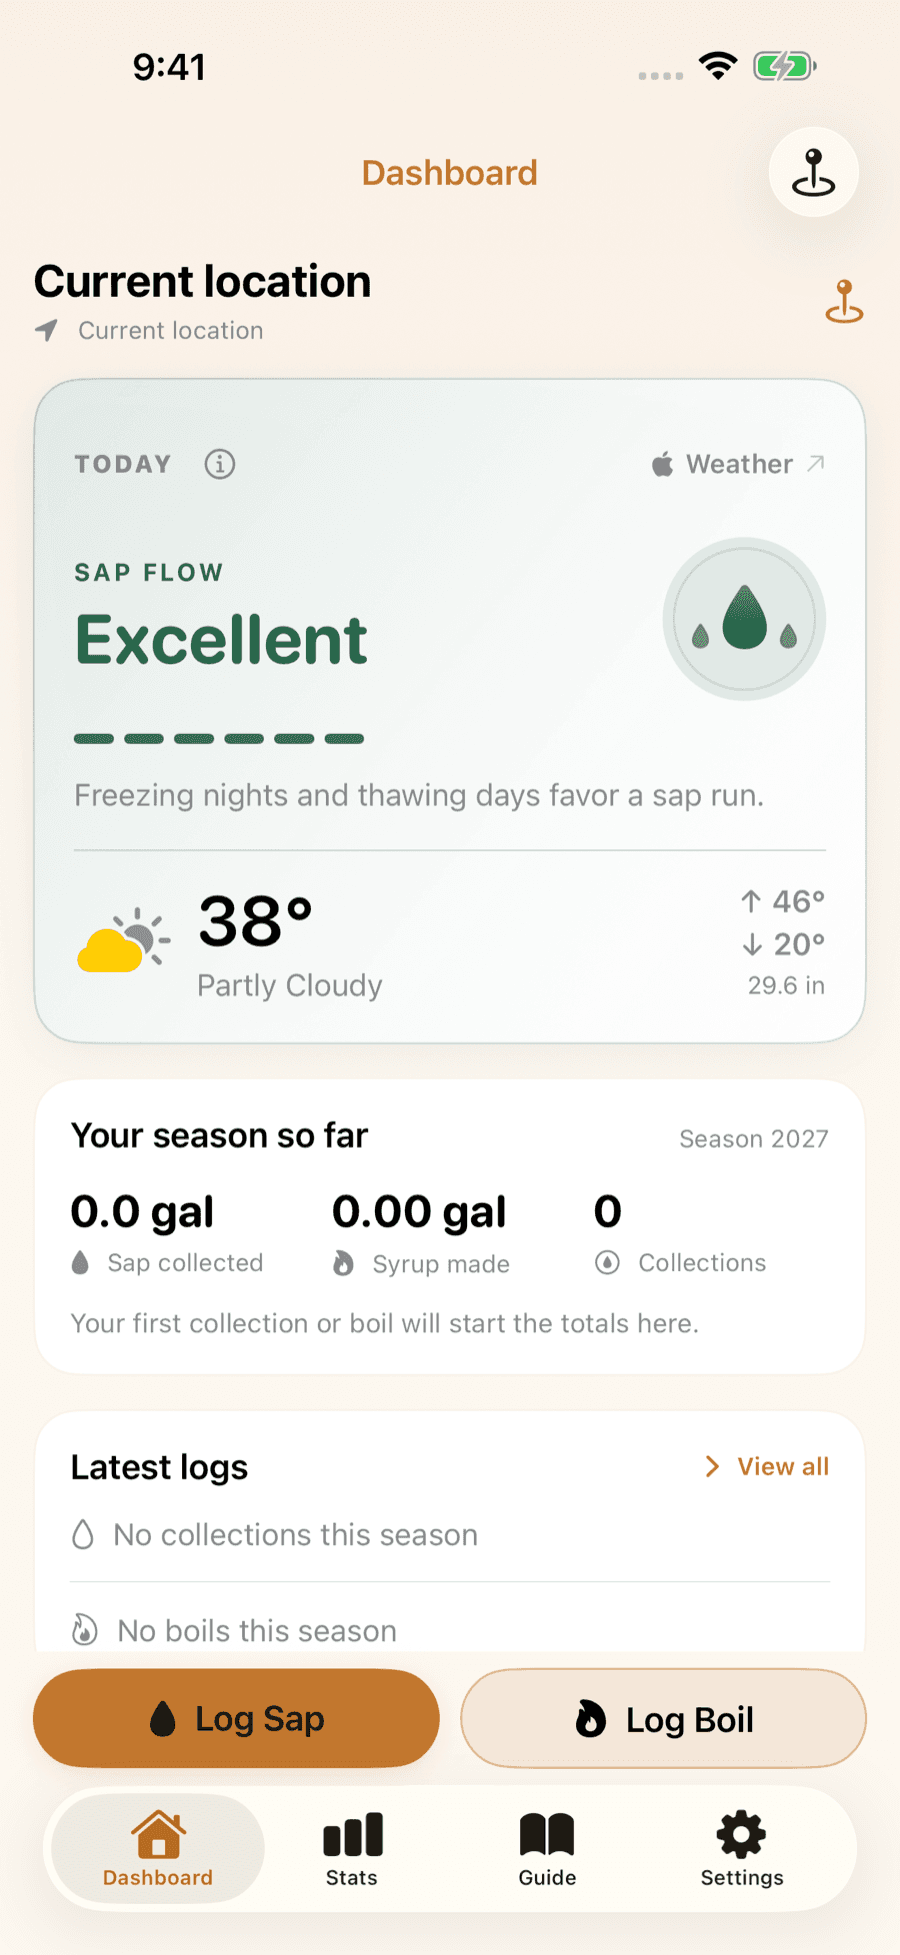
LuckySap watches the forecast for your trees and can ping you the night before a strong sap day, then keeps every collection and boil in one season log. Free on iPhone and Android.